
Elevating the Decentralized Data Indexing Experience for SubQuery Kepler

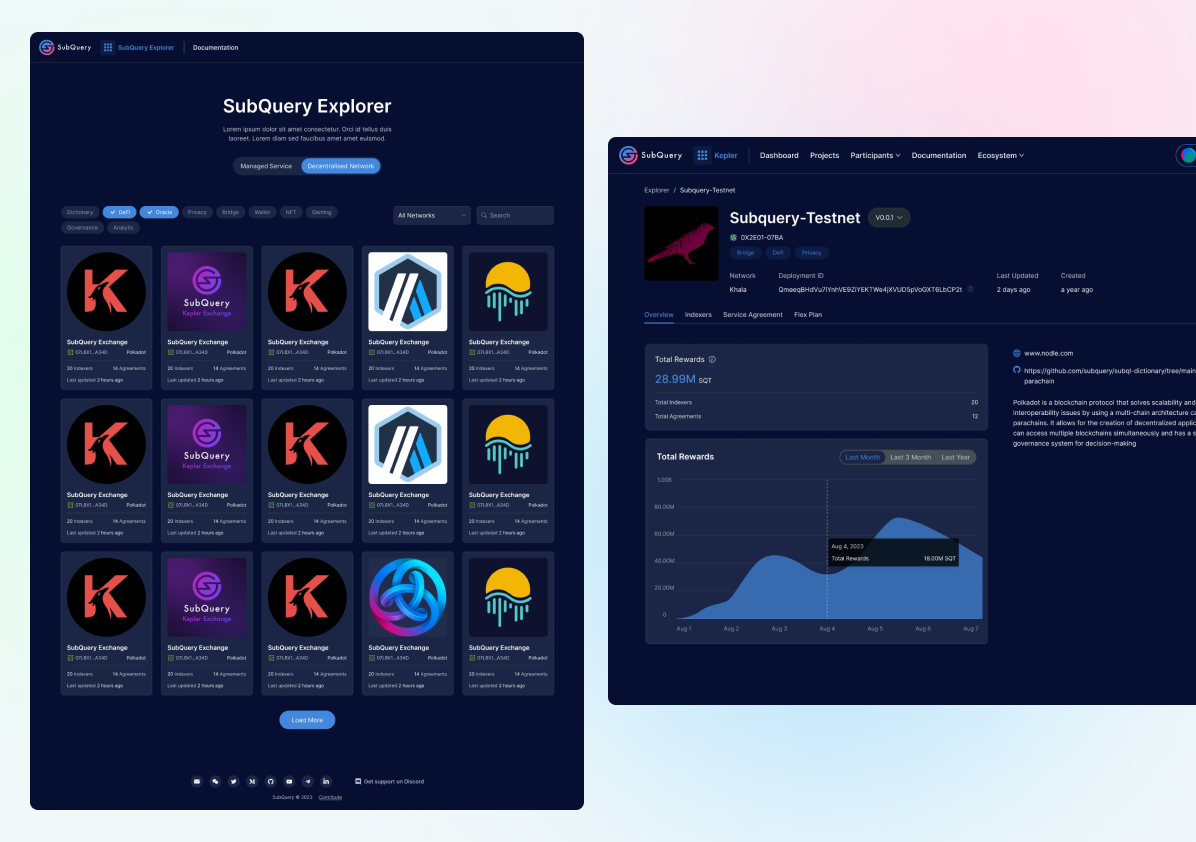
SubQuery Kepler aims to provide developers with easy access to indexed data from various blockchain networks, enabling efficient and fast querying for decentralized applications (dApps). The article delves into the design process, user research, and iterative design solutions to create a seamless user experience.
The SubQuery's primary users were developers who needed efficient and decentralized indexing and querying of blockchain data. These developers were building various blockchain-based applications and services, including:
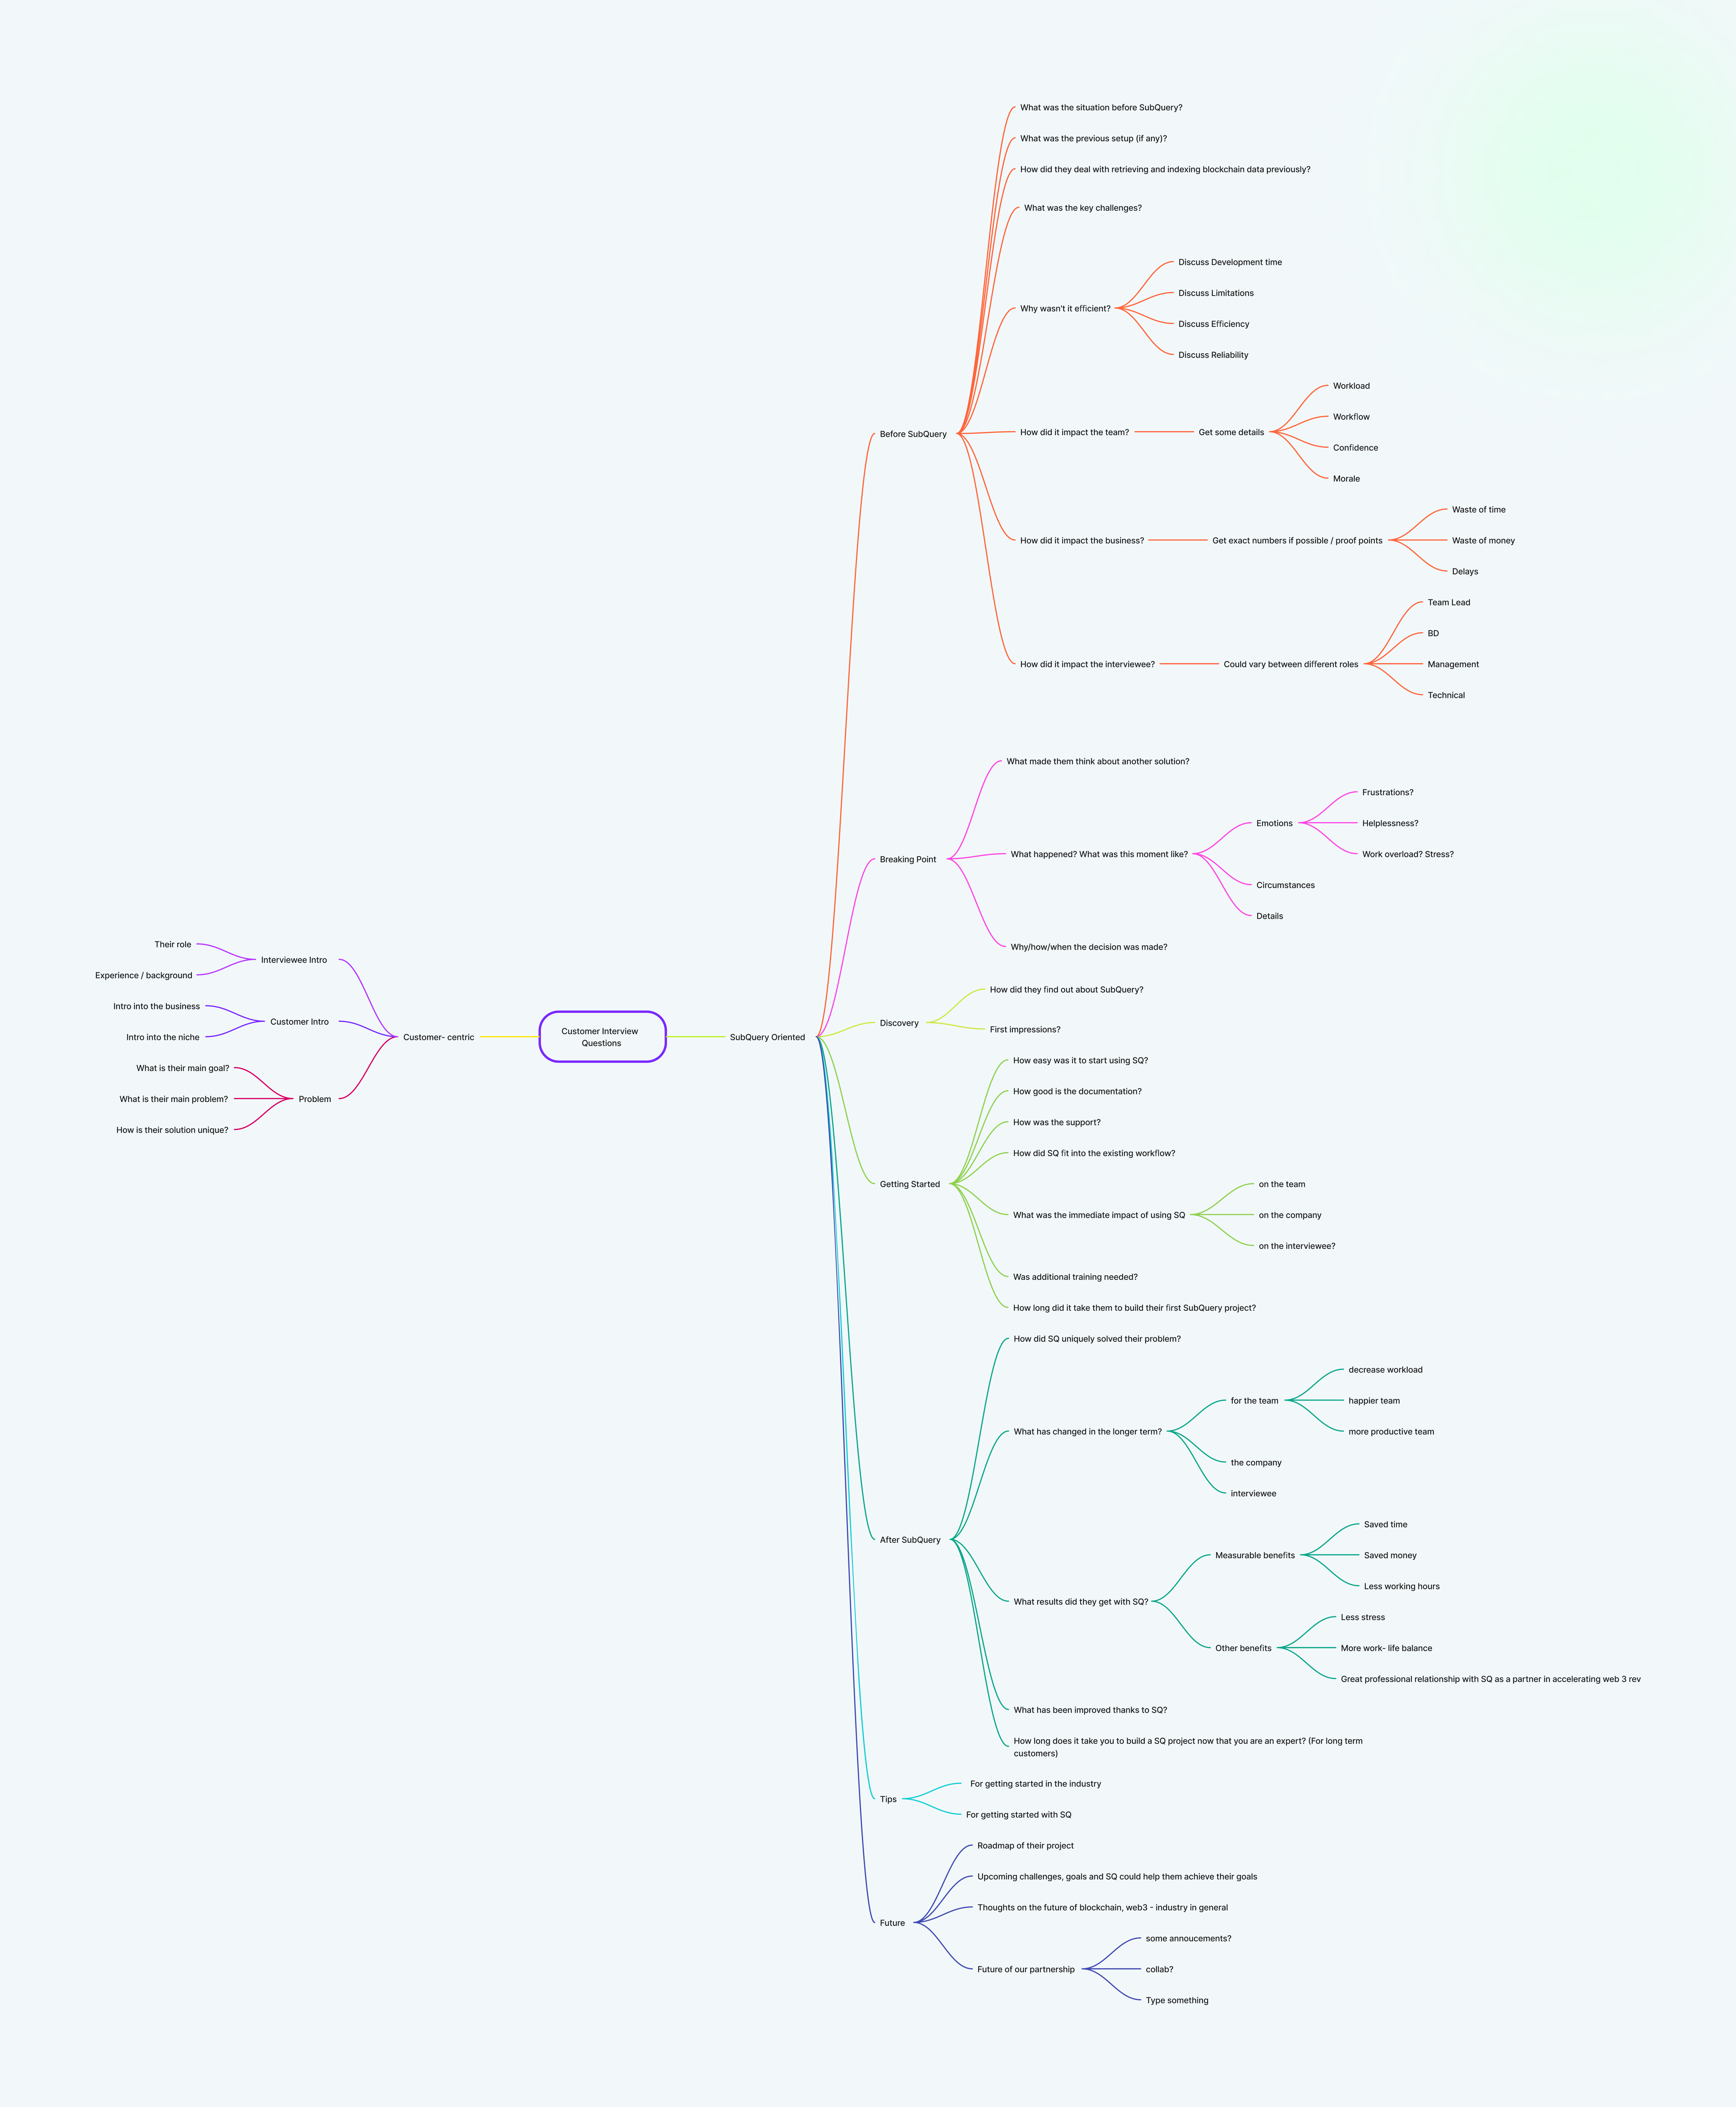
We conducted 8 in-depth interviews with blockchain developers. Before start the interview, we made a mind chart to demonstrate the possible questions that we can ask to customers. The insights revealed that users were often overwhelmed by the complexity of existing tools and desired a more easy interface.
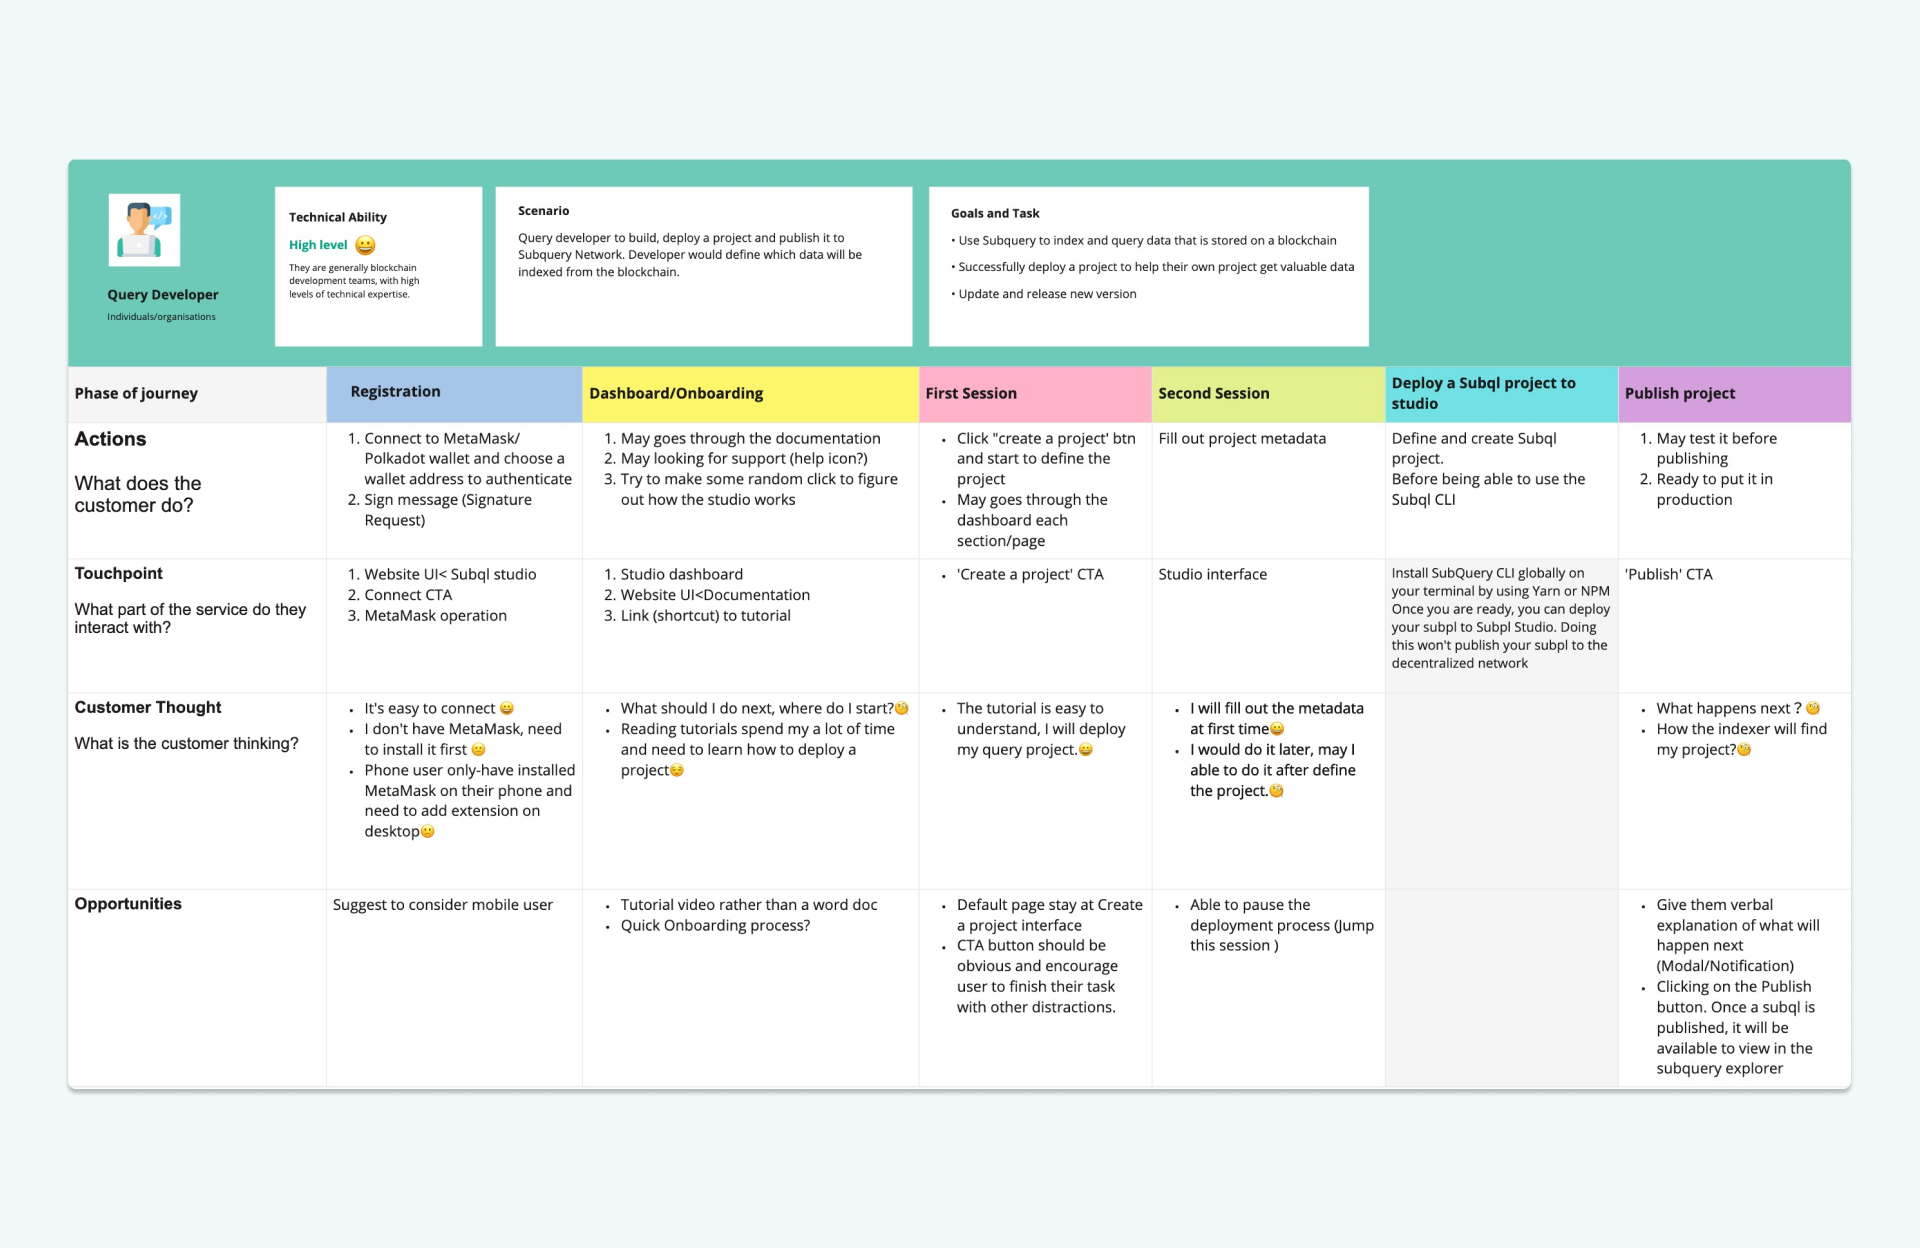
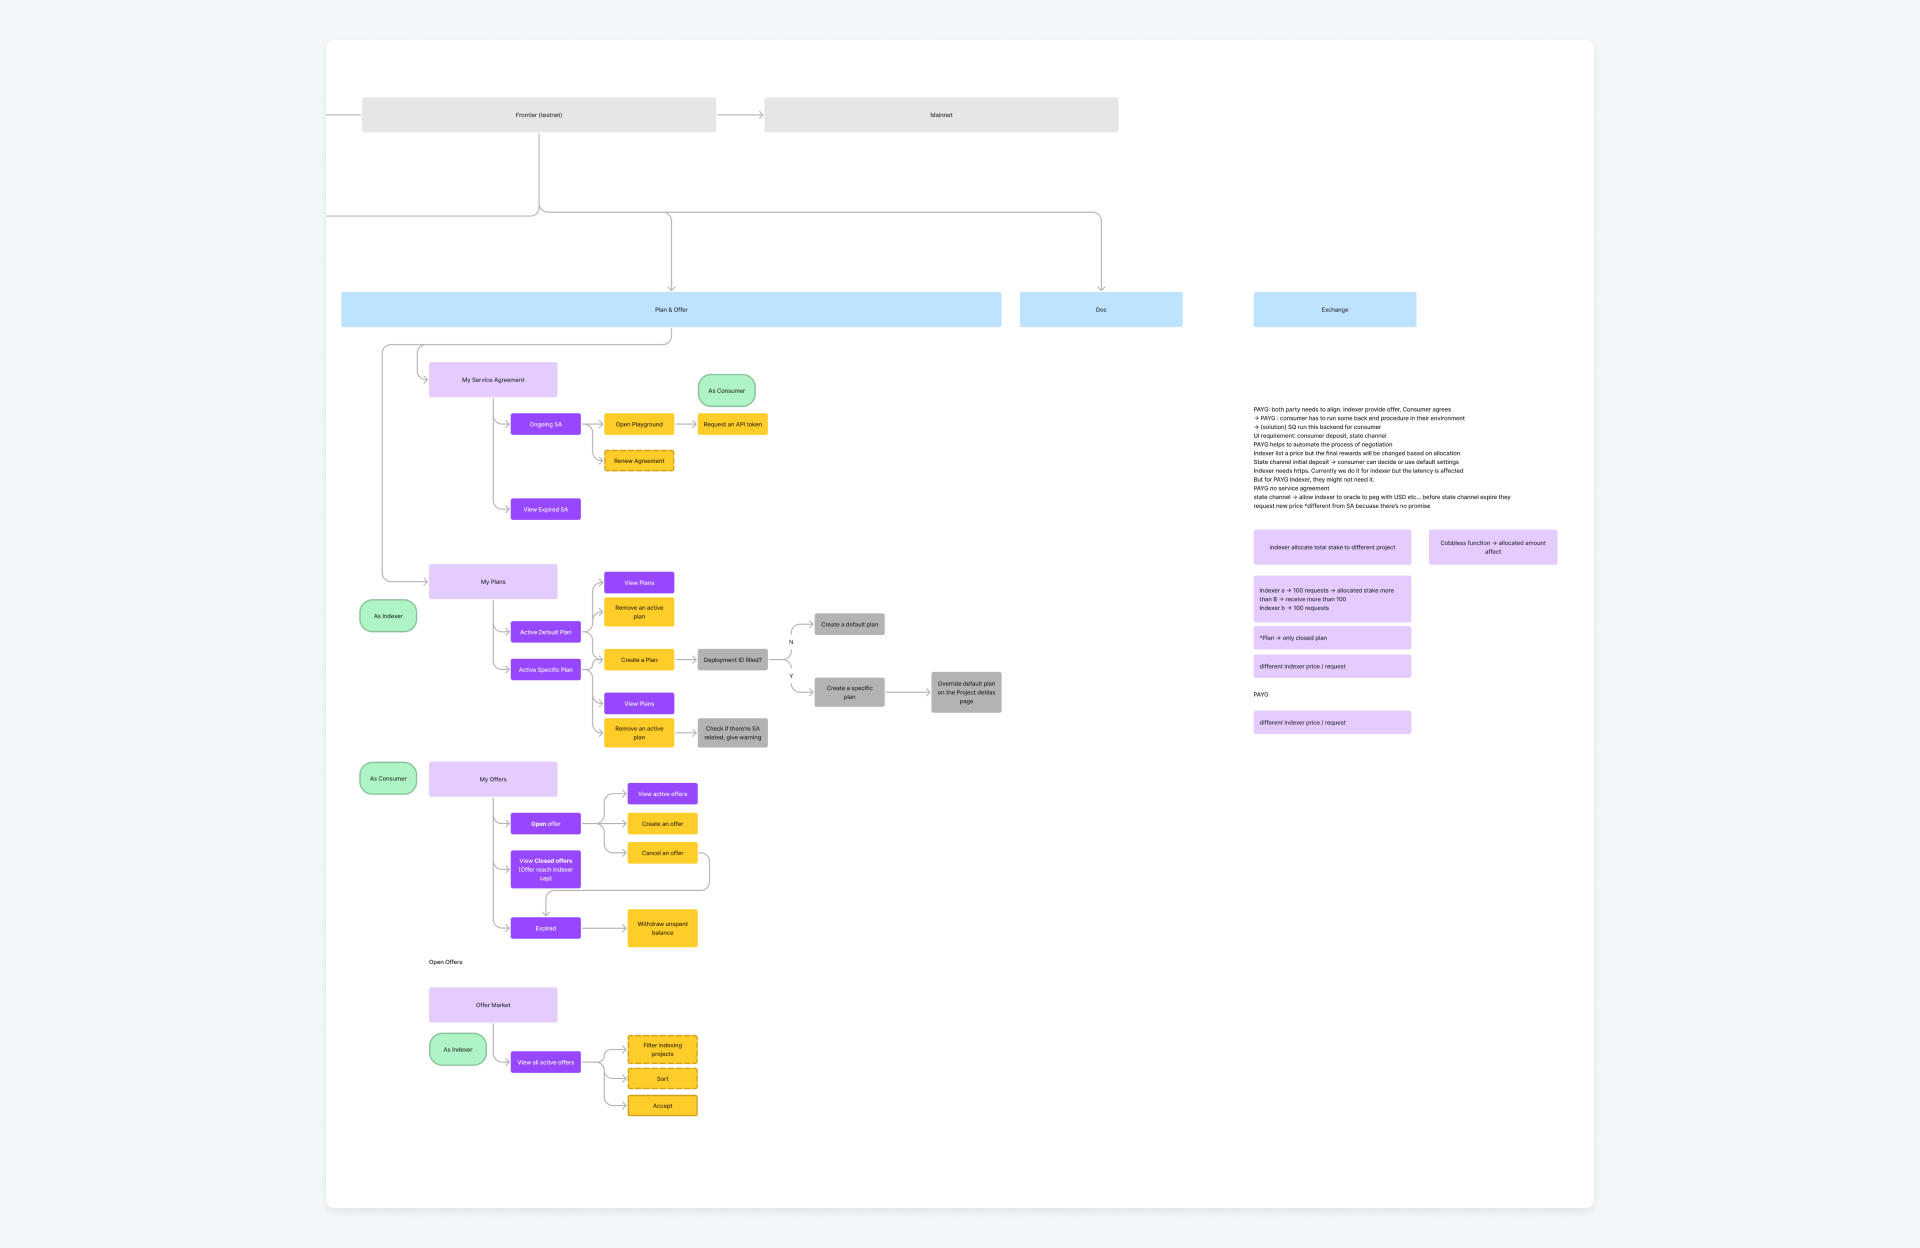
Next, I created a visual user journey map the user's path from start to finish. Include touchpoints with the product and any relevant actions, which help to understand the steps users take to achieve their goals within the product.
When we work on a complex project/feature, I will buid a design sprint plan to help the design team to collaborates to solve a particular problem. I found it helps team to brainstorm effectively and speed up the decision making process.
Phase1 Establish the main problem to focus during the sprint, create a design roadmap for the whole week and gather the information
Phase2 Ideate solutions. The focus of this phase is brainstorming, ideating features, and discussing user flows and journeys
Phase3 Decide which solution is the best and prepare for prototyping
Phase4 Create a rapid prototype of a chosen solution, which will allow you to visualize your idea.
Phase5 Gather feedback after testing a prototype with real users.
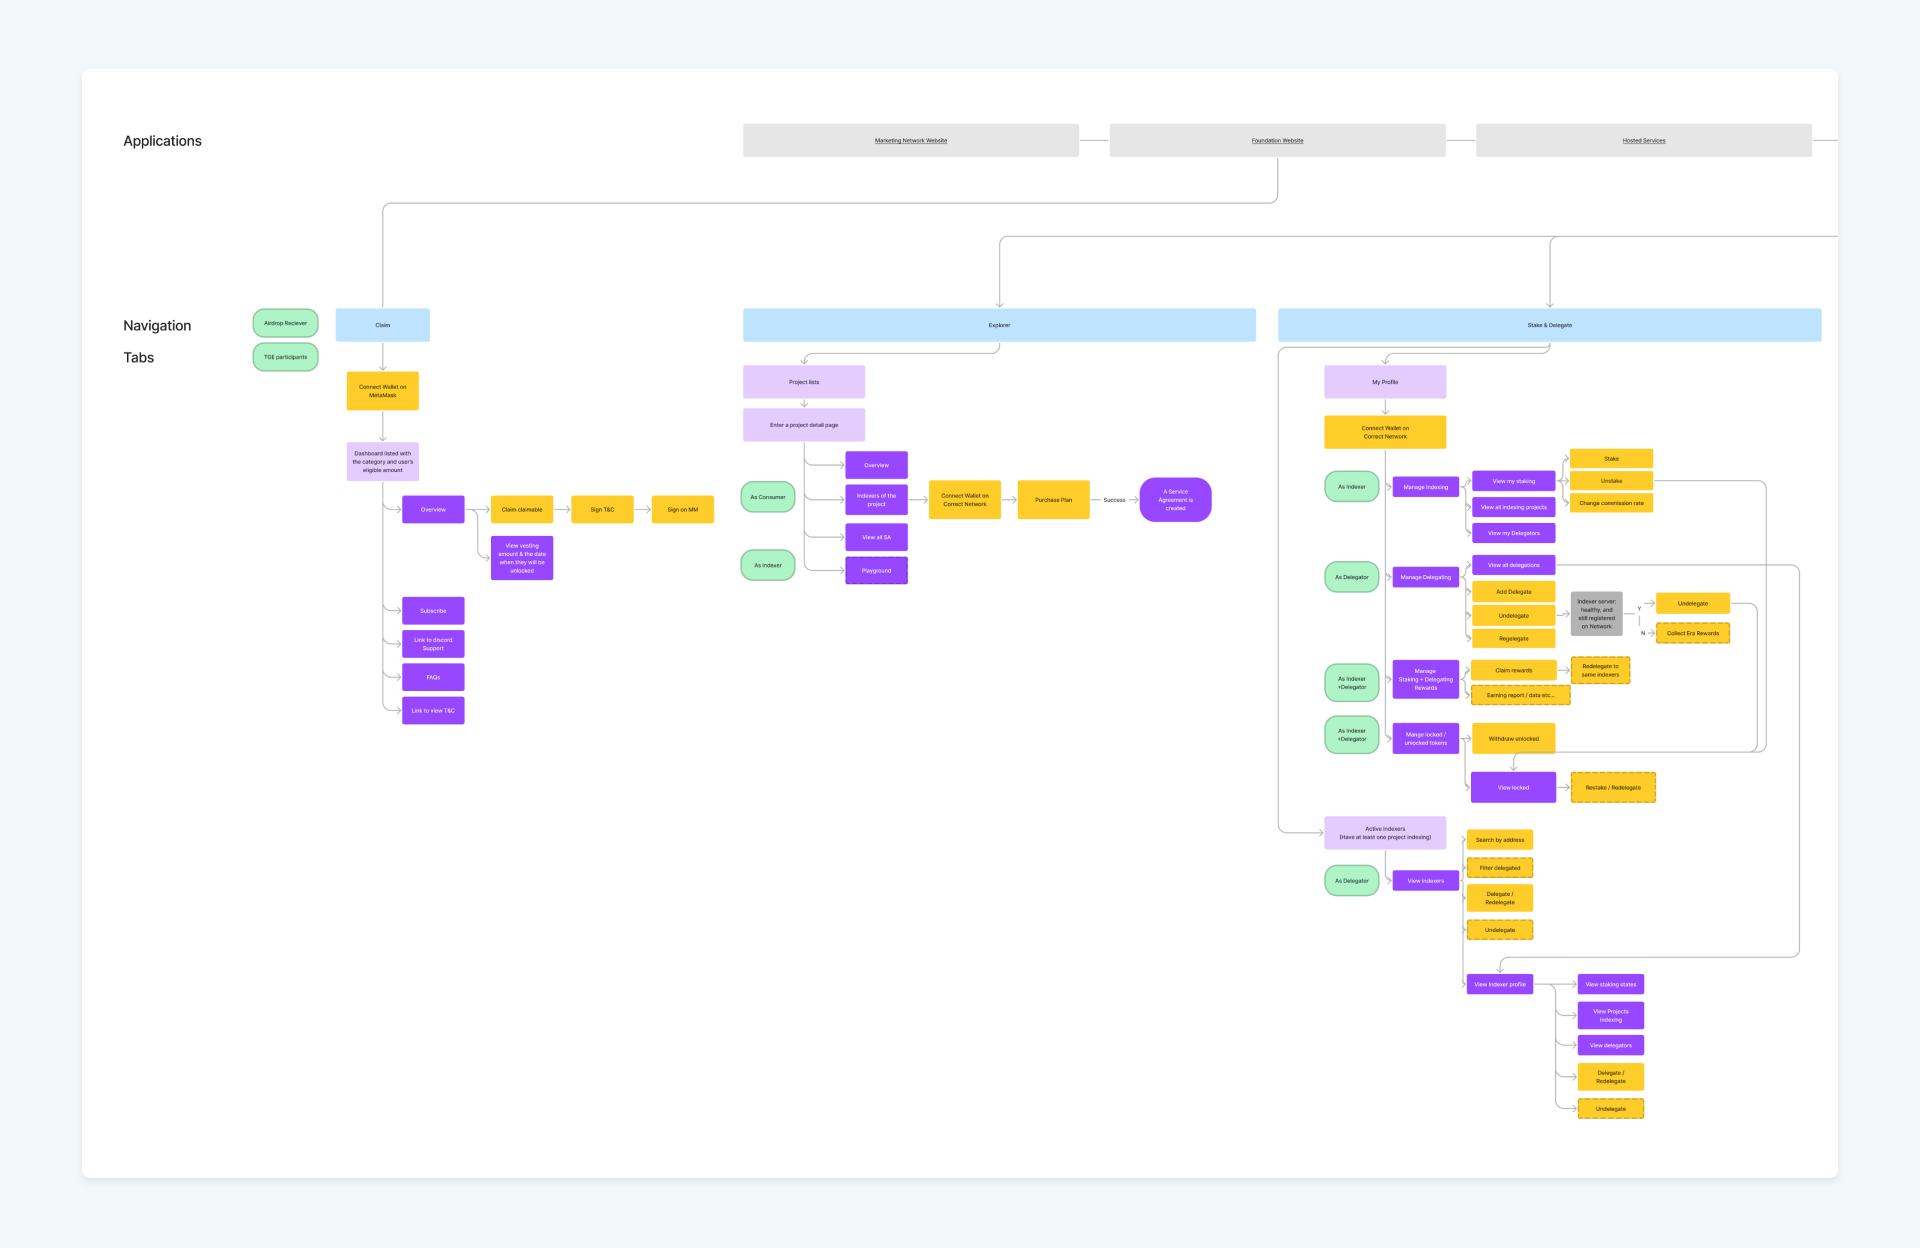
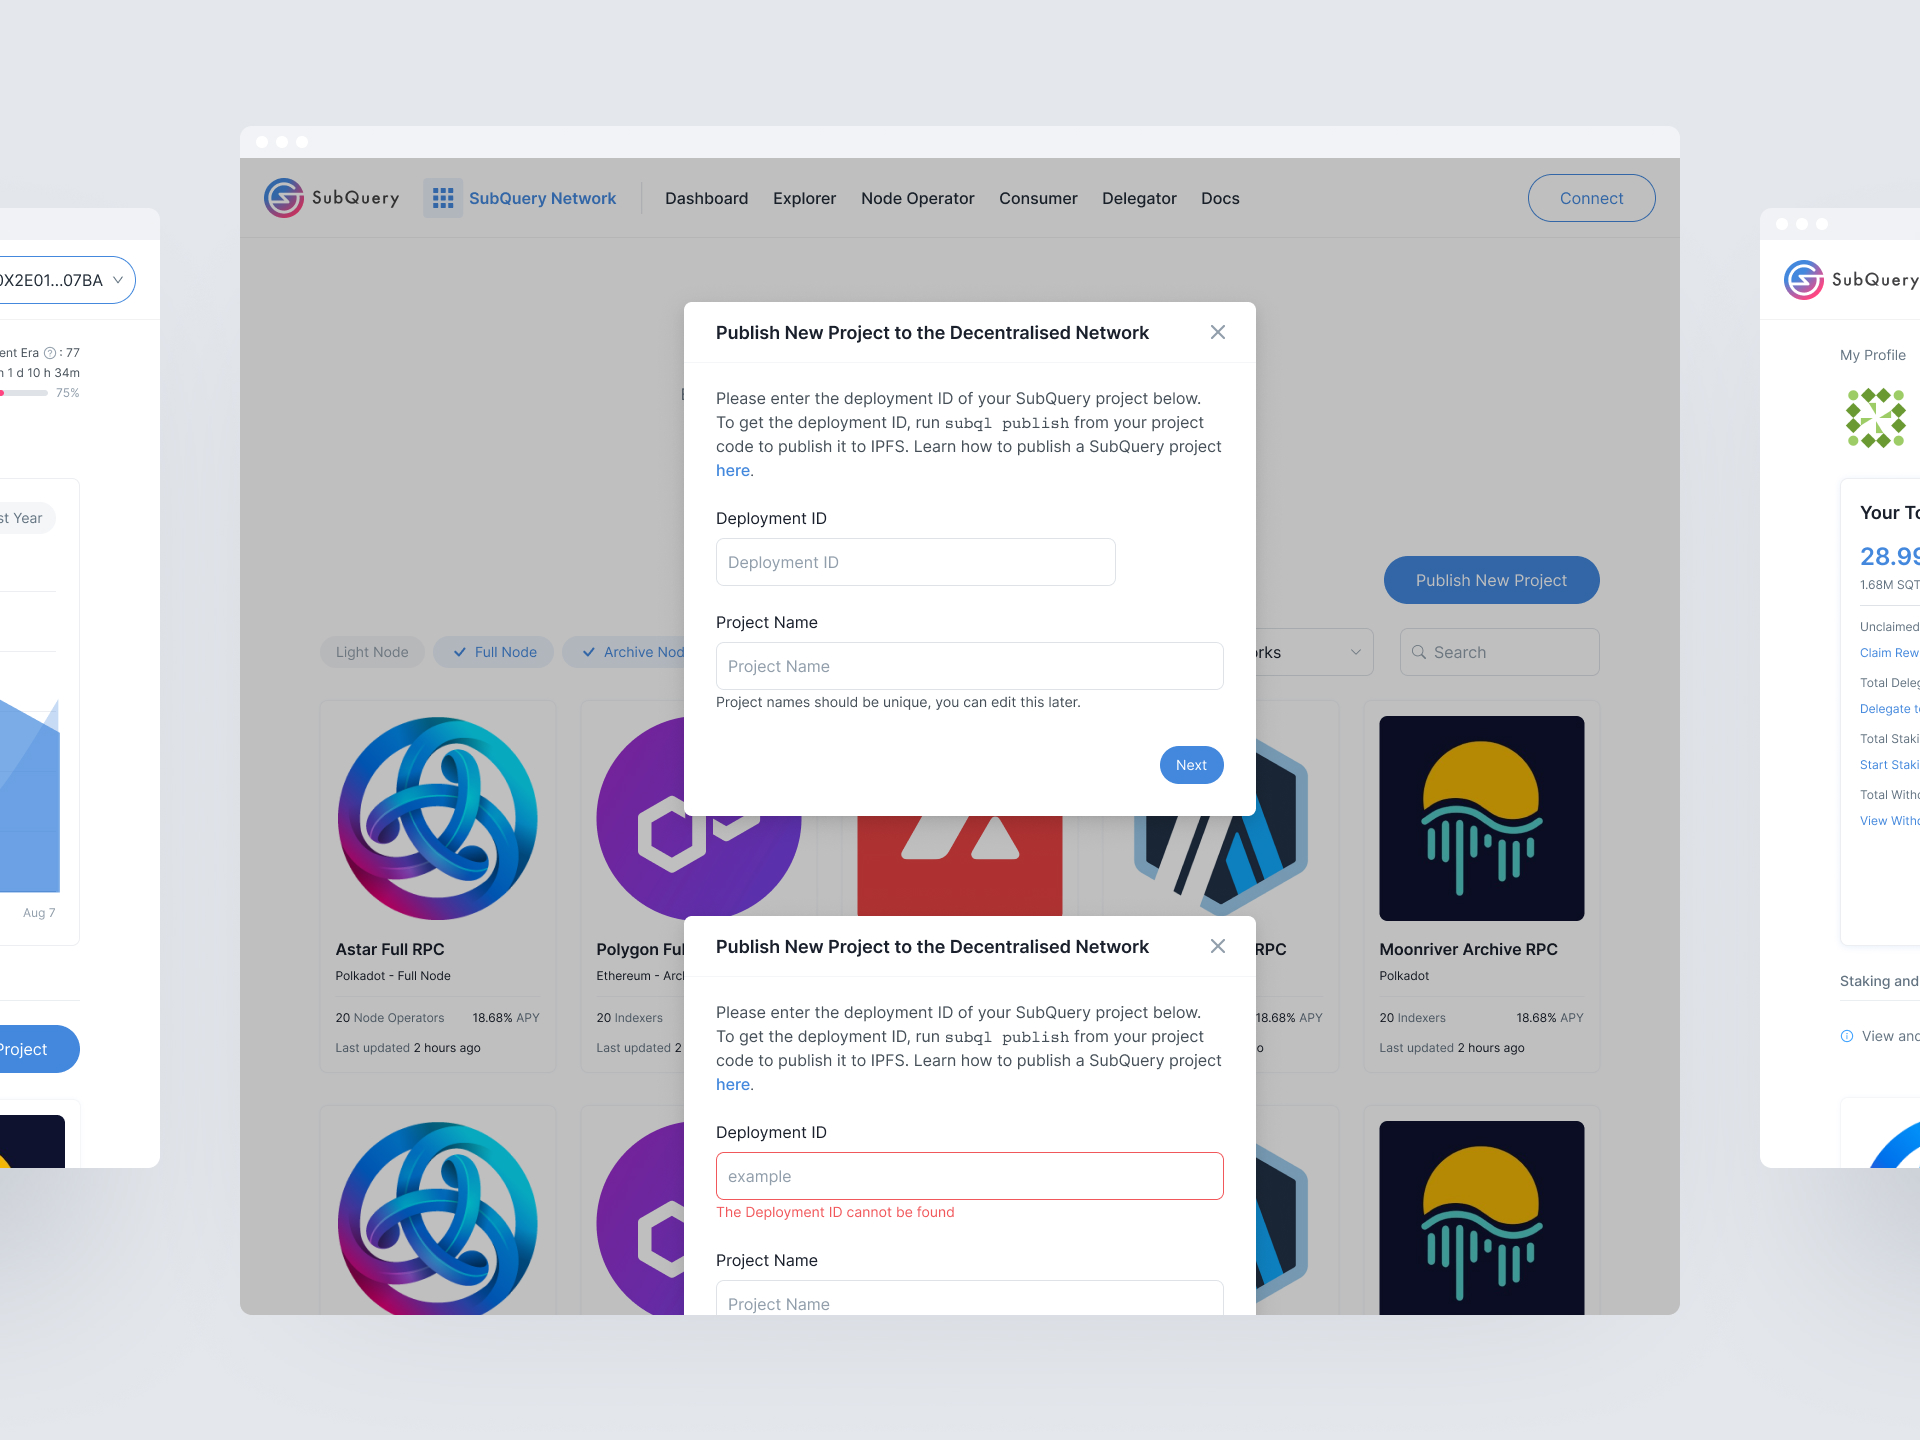
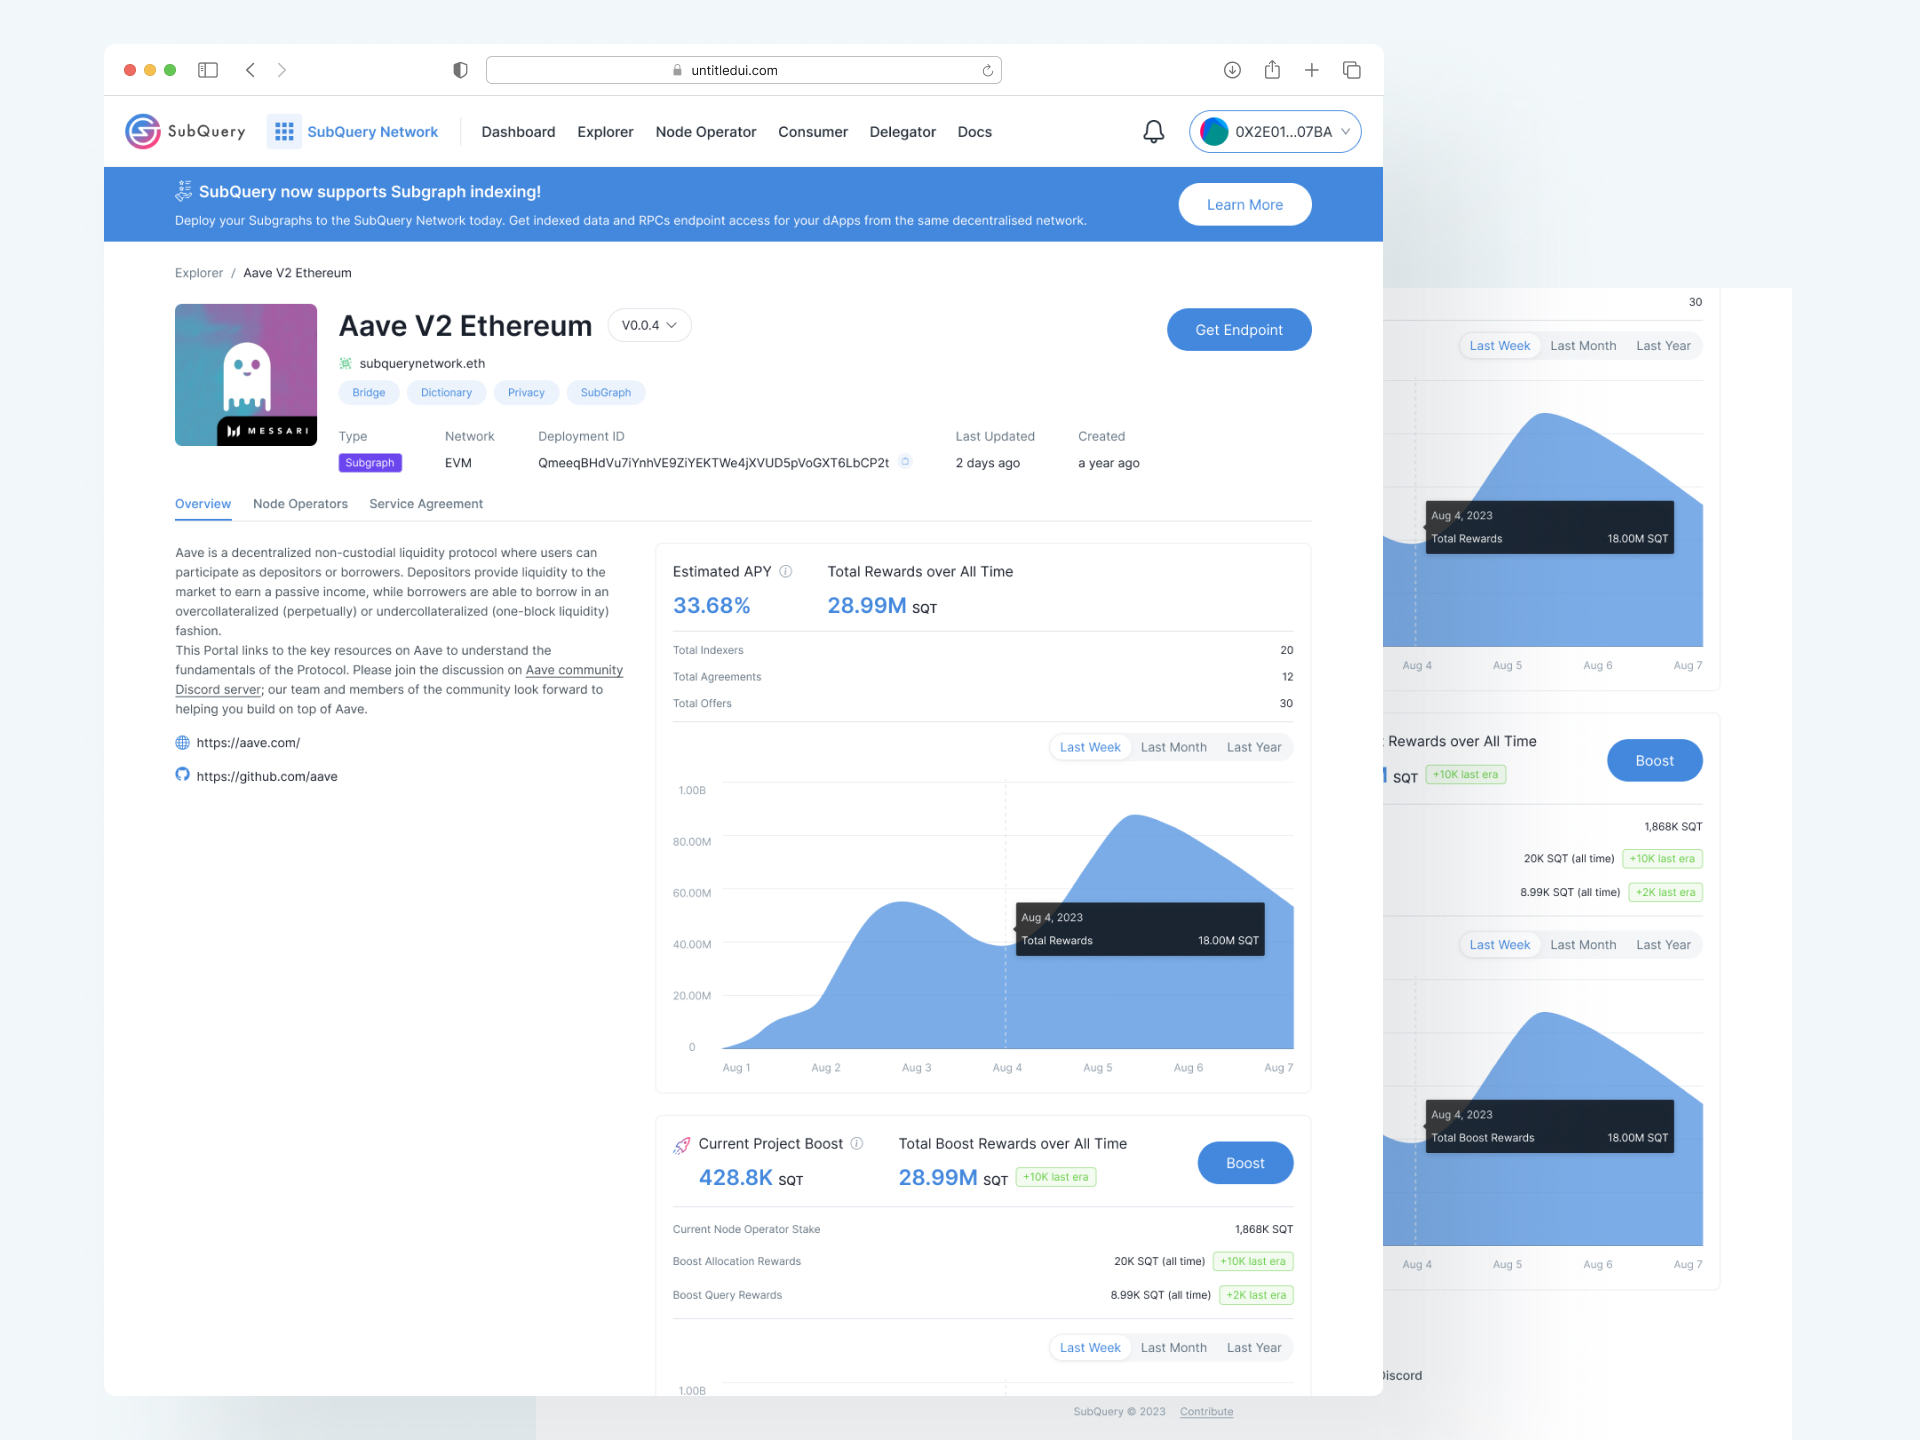
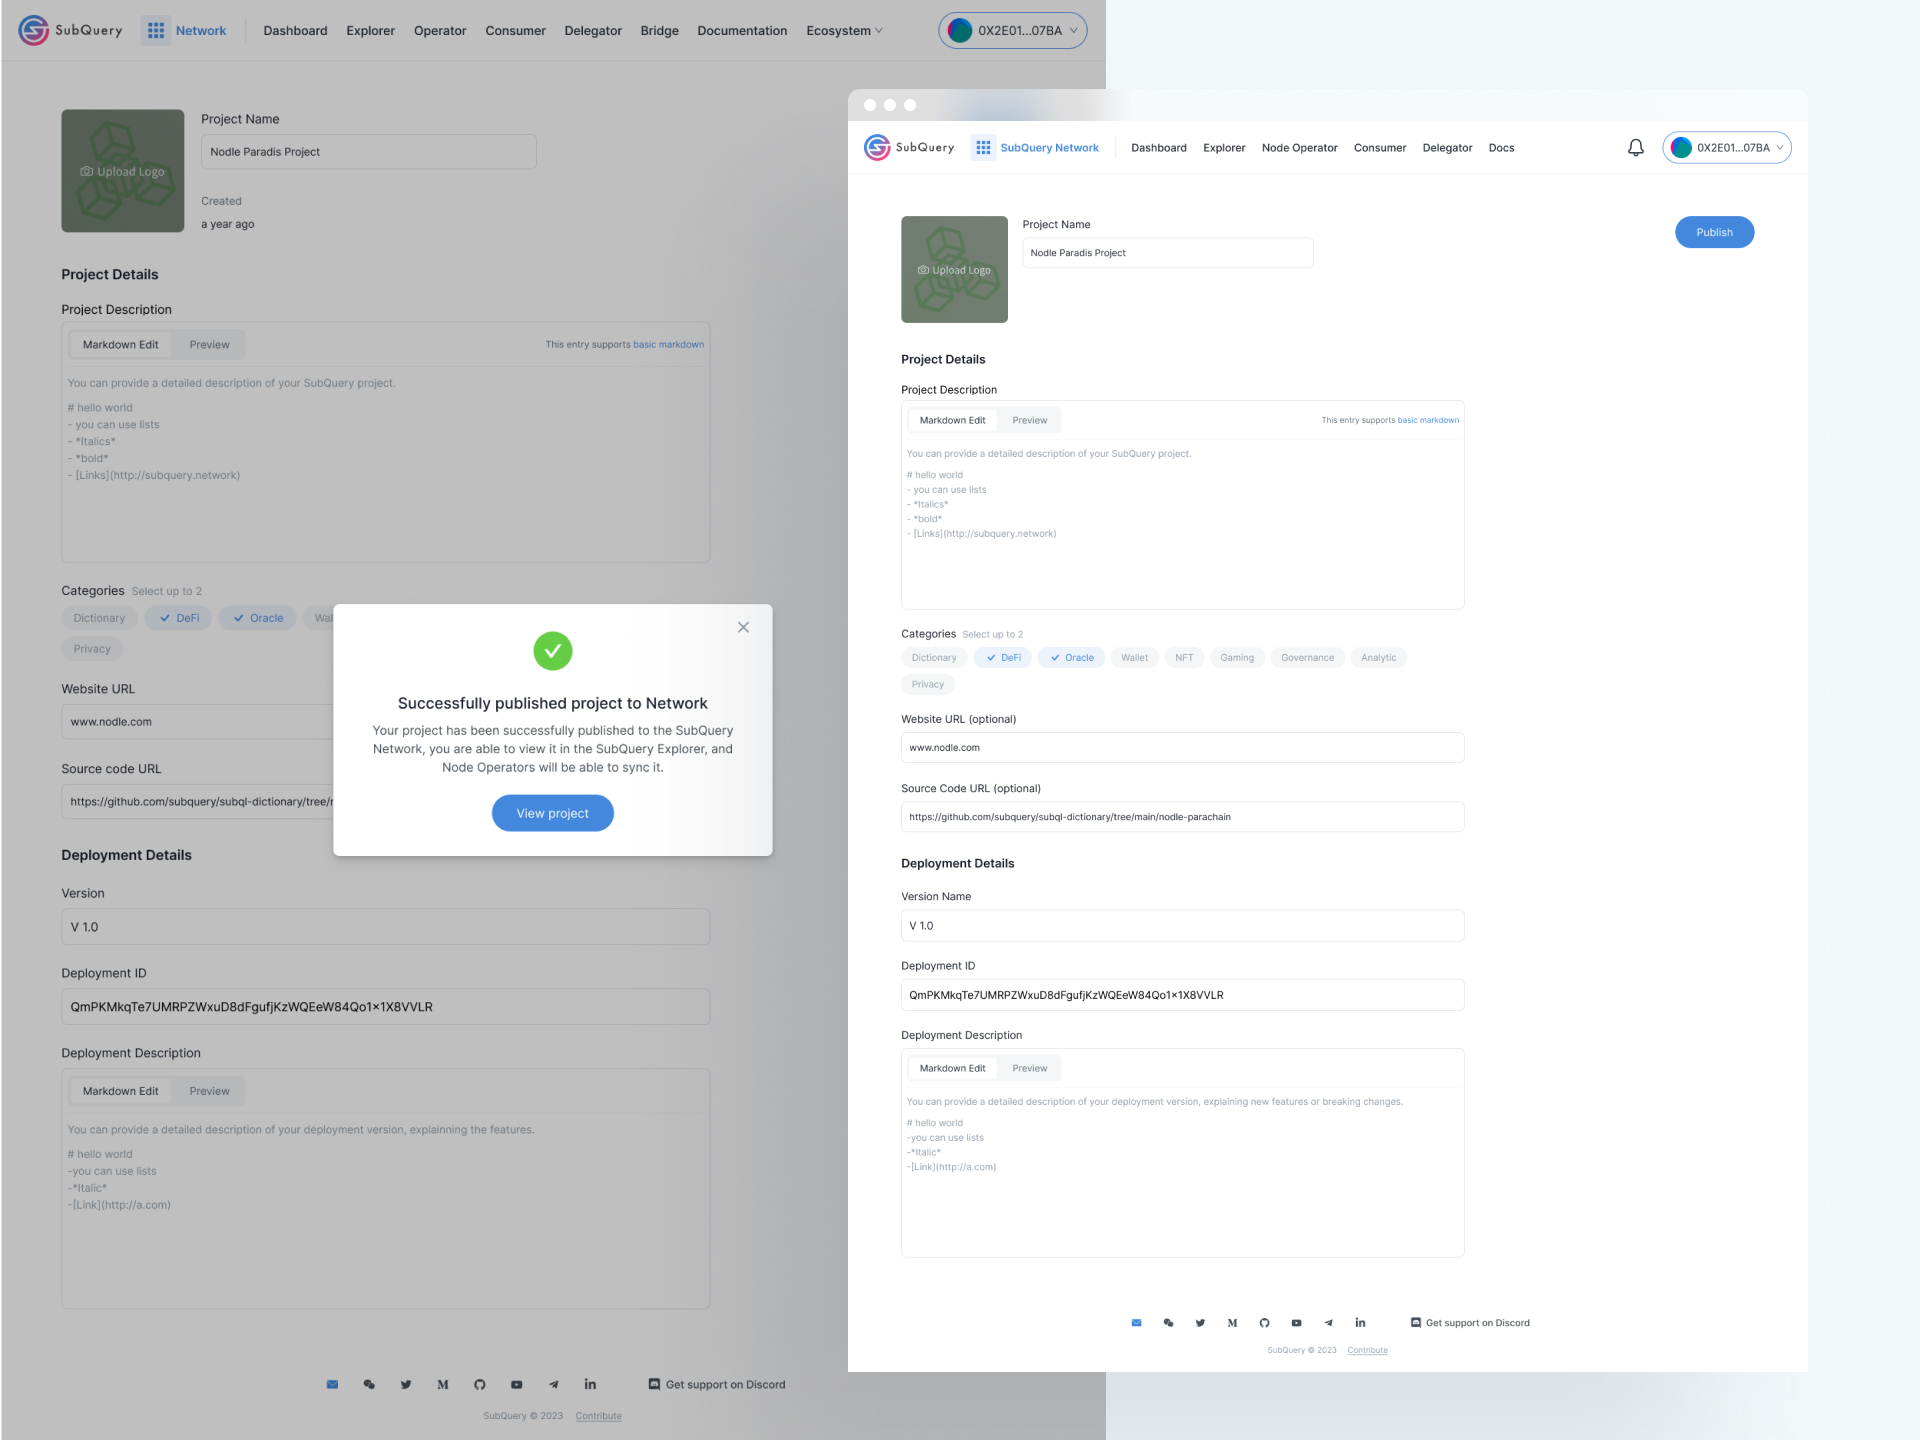
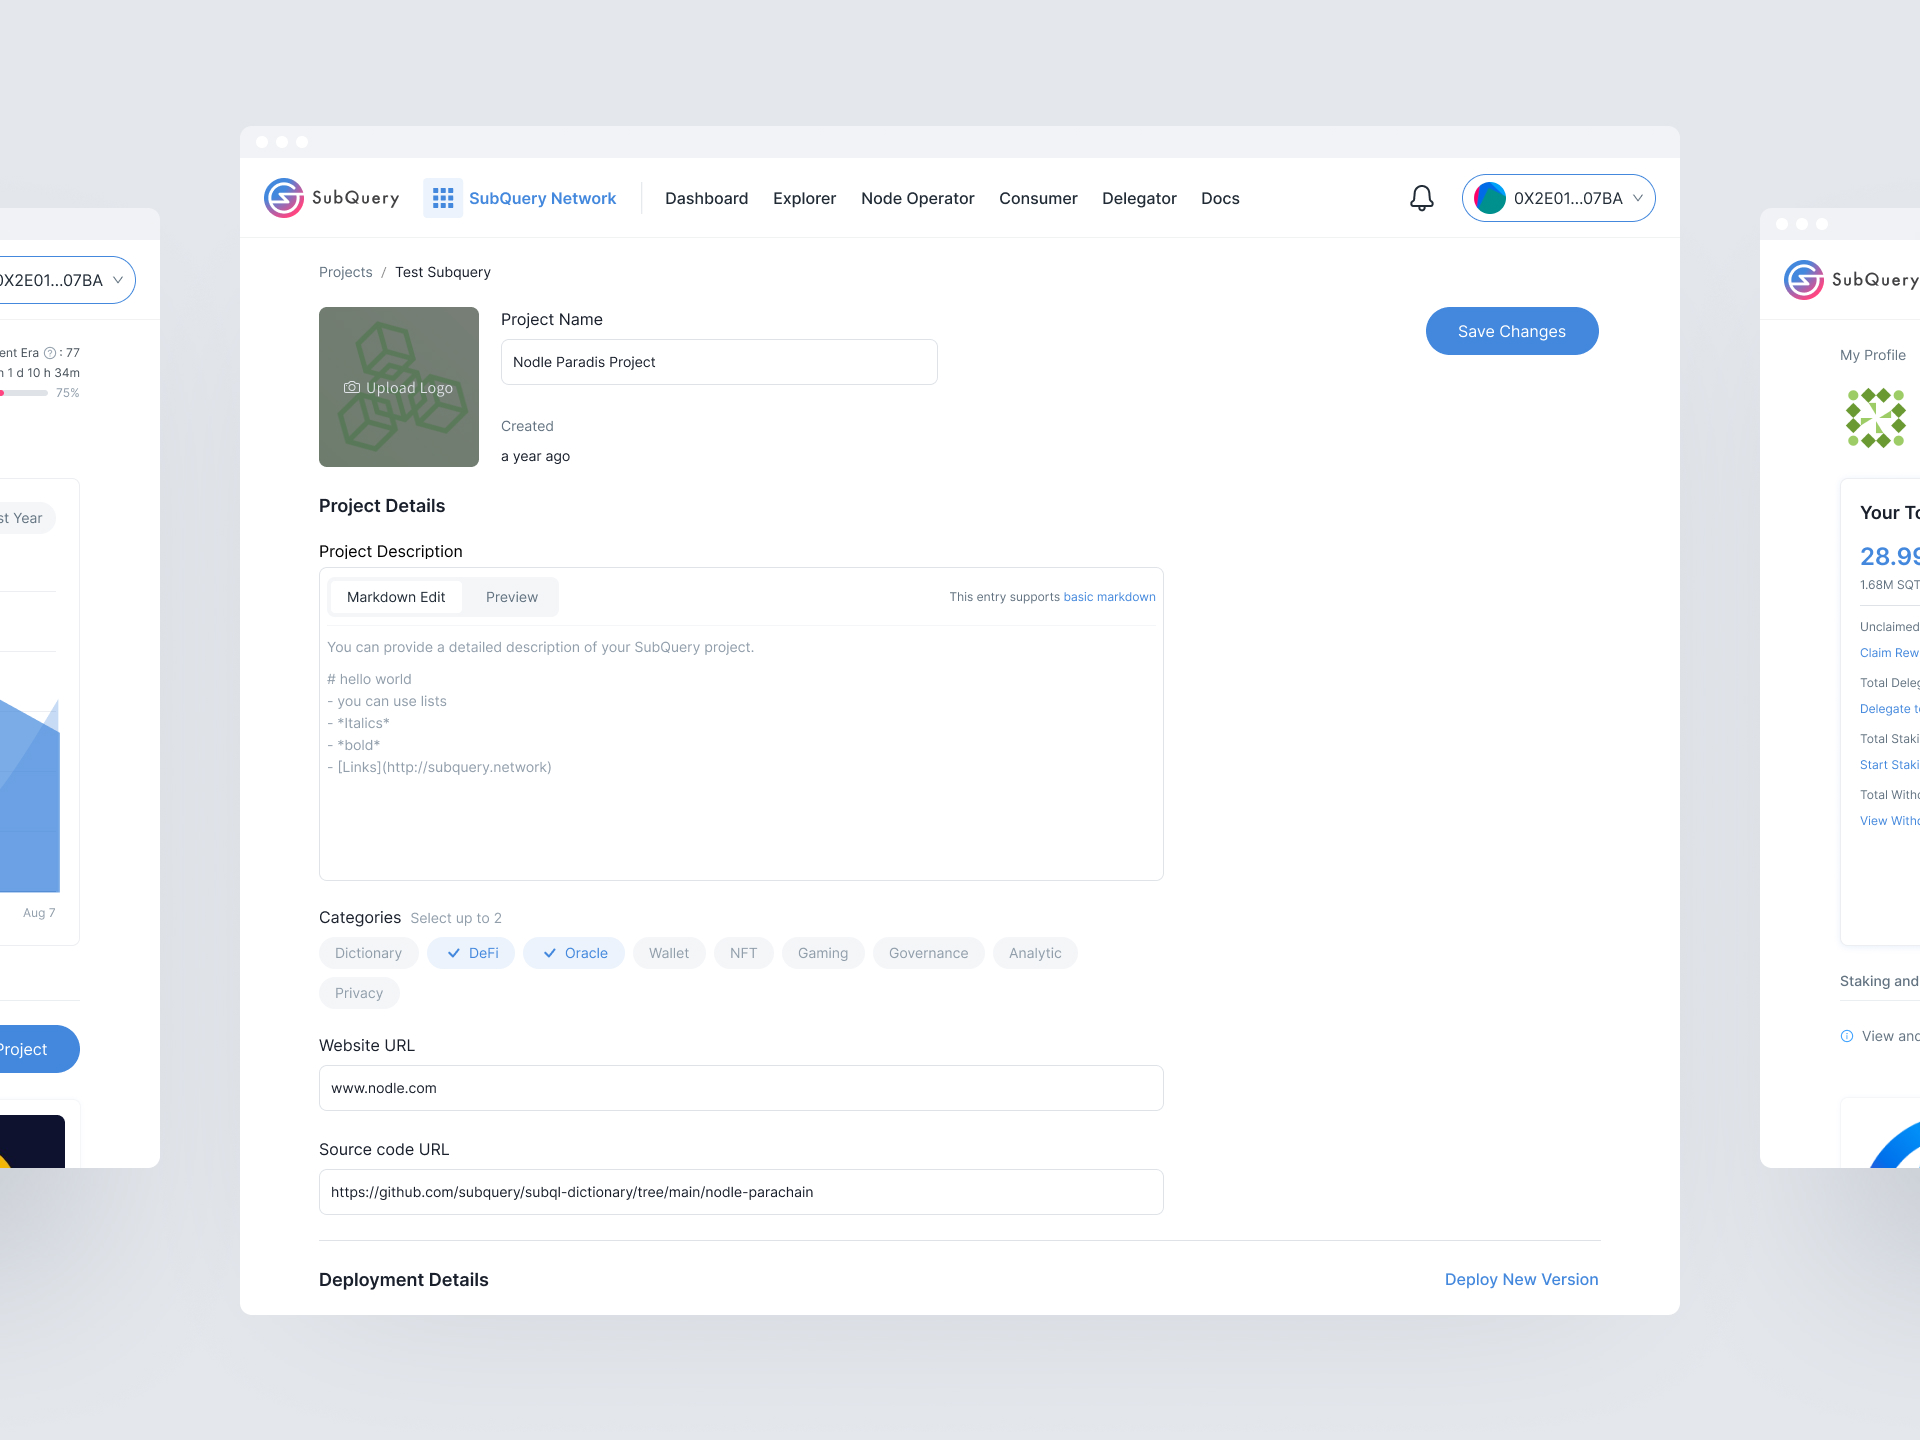
Streamlined the user flow, allowing users to select specify data parameters, and visualize results without unnecessary complexities.

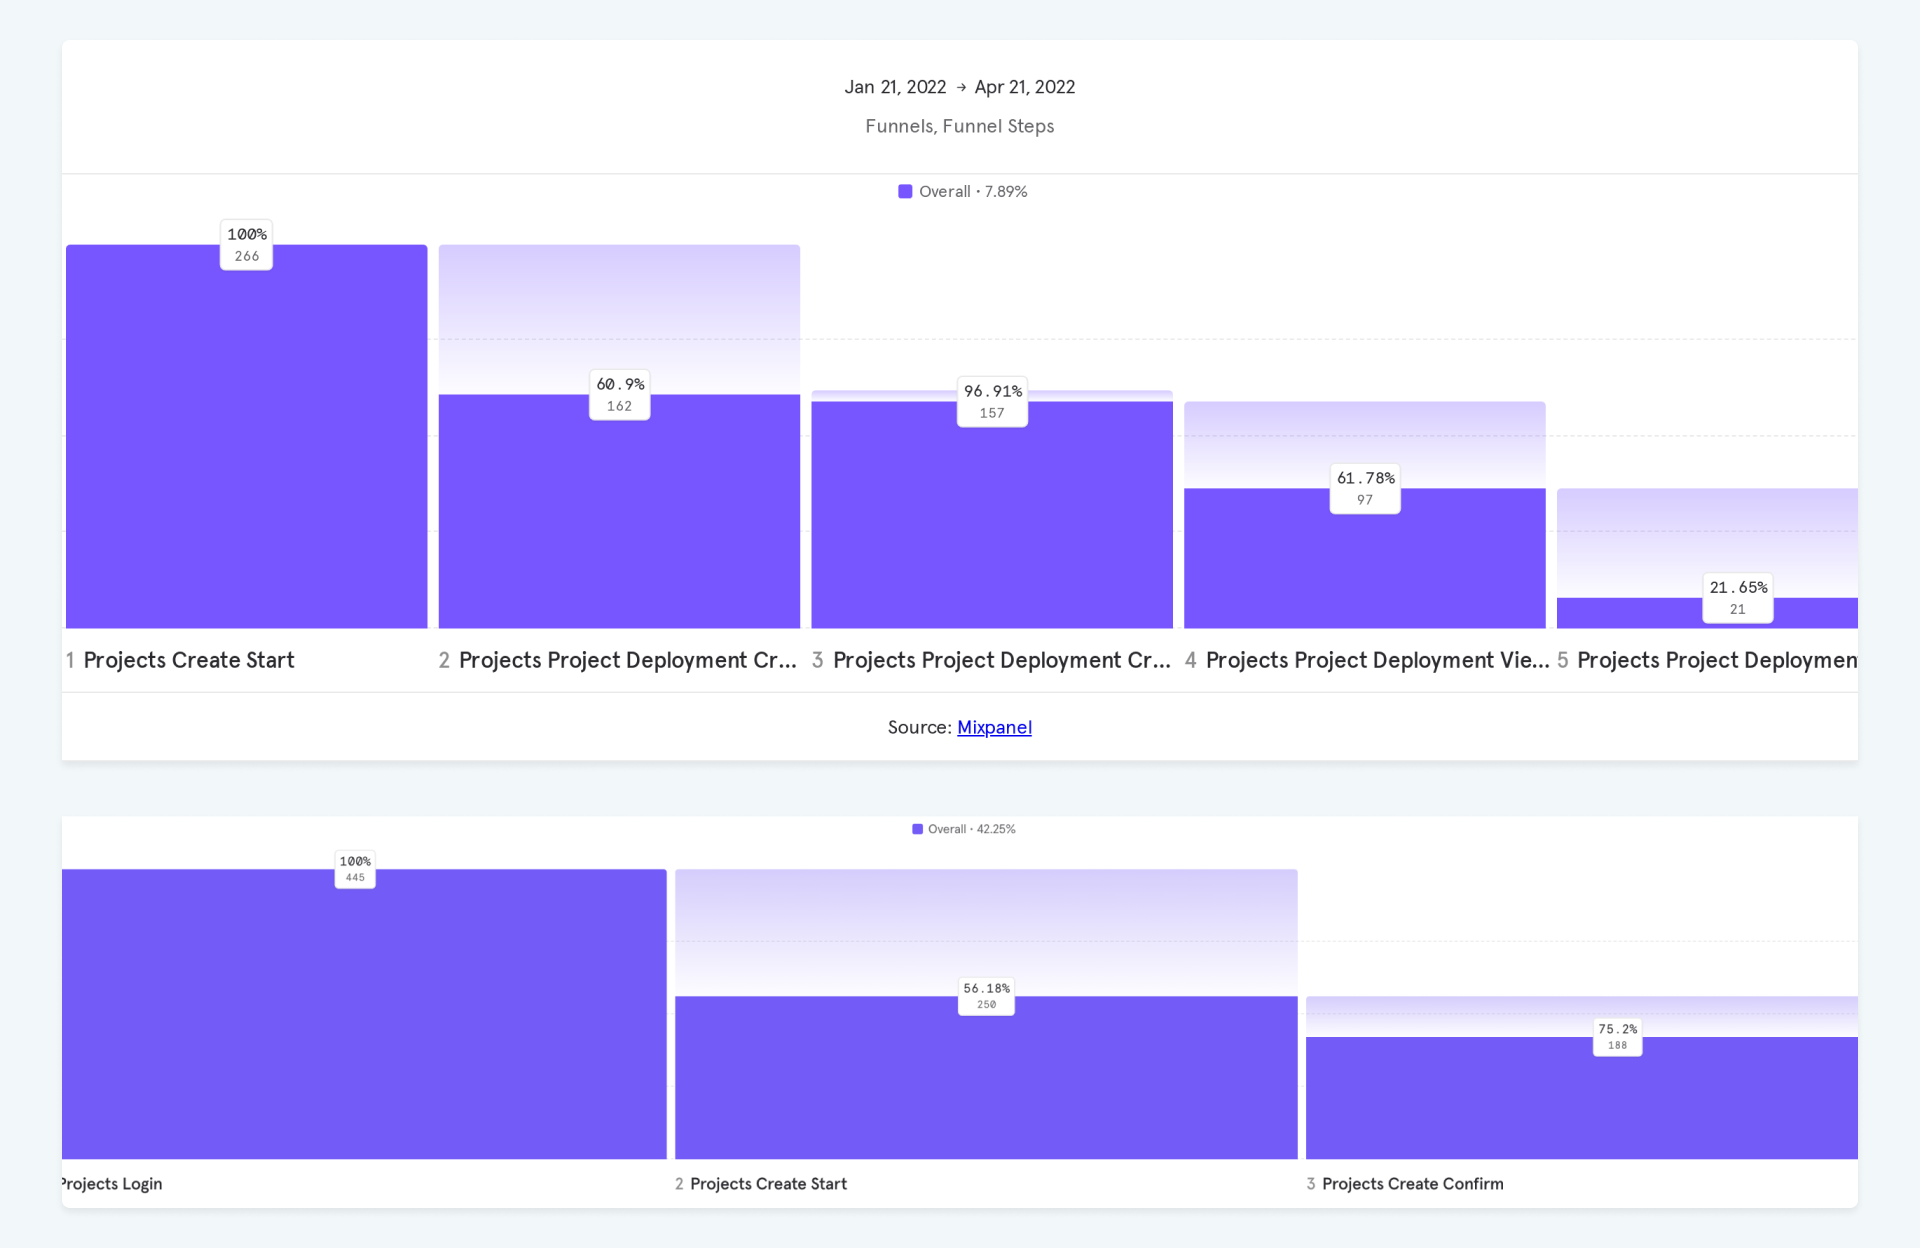
To continually improve our product’s usability and deliver a seamless experience, we implemented MixPanel to track user interactions and measure task completion rates. Our goal was to identify specific stages in the user journey that might lead to drop-offs or slow task completion, providing us with actionable insights to refine the UX further.
The primary aim was to understand user behavior across key tasks, enabling a data-driven approach to optimize the user journey. By tracking specific events, we could pinpoint challenges users encountered and assess the effectiveness of our UI changes.
We began by identifying critical tasks that reflected the core functionalities of our product. These tasks were essential to user engagement and retention, as they formed the basis of users’ daily interactions within our app.
Each task was broken down into its main components, which we mapped out in a user journey framework. This ensured we captured the full scope of each task, from initiation to completion.
Once we defined the key tasks, we set up five specific events in MixPanel to monitor:
For each event, we defined specific metrics:
We also set up funnels in MixPanel to visualize the user journey across these events, focusing on the sequence from onboarding to task submission.
One major challenge was balancing the need for a powerful tool with the simplicity desired by new users. Iterative testing and feedback were crucial in achieving this balance.
This project underscored the importance of user-centered design in the complex field of decentralized data. It taught us the value of iterative development and constant user feedback.
