Redesign of Multi-chain Api service for dApp and Web3 users to get data from blockchain


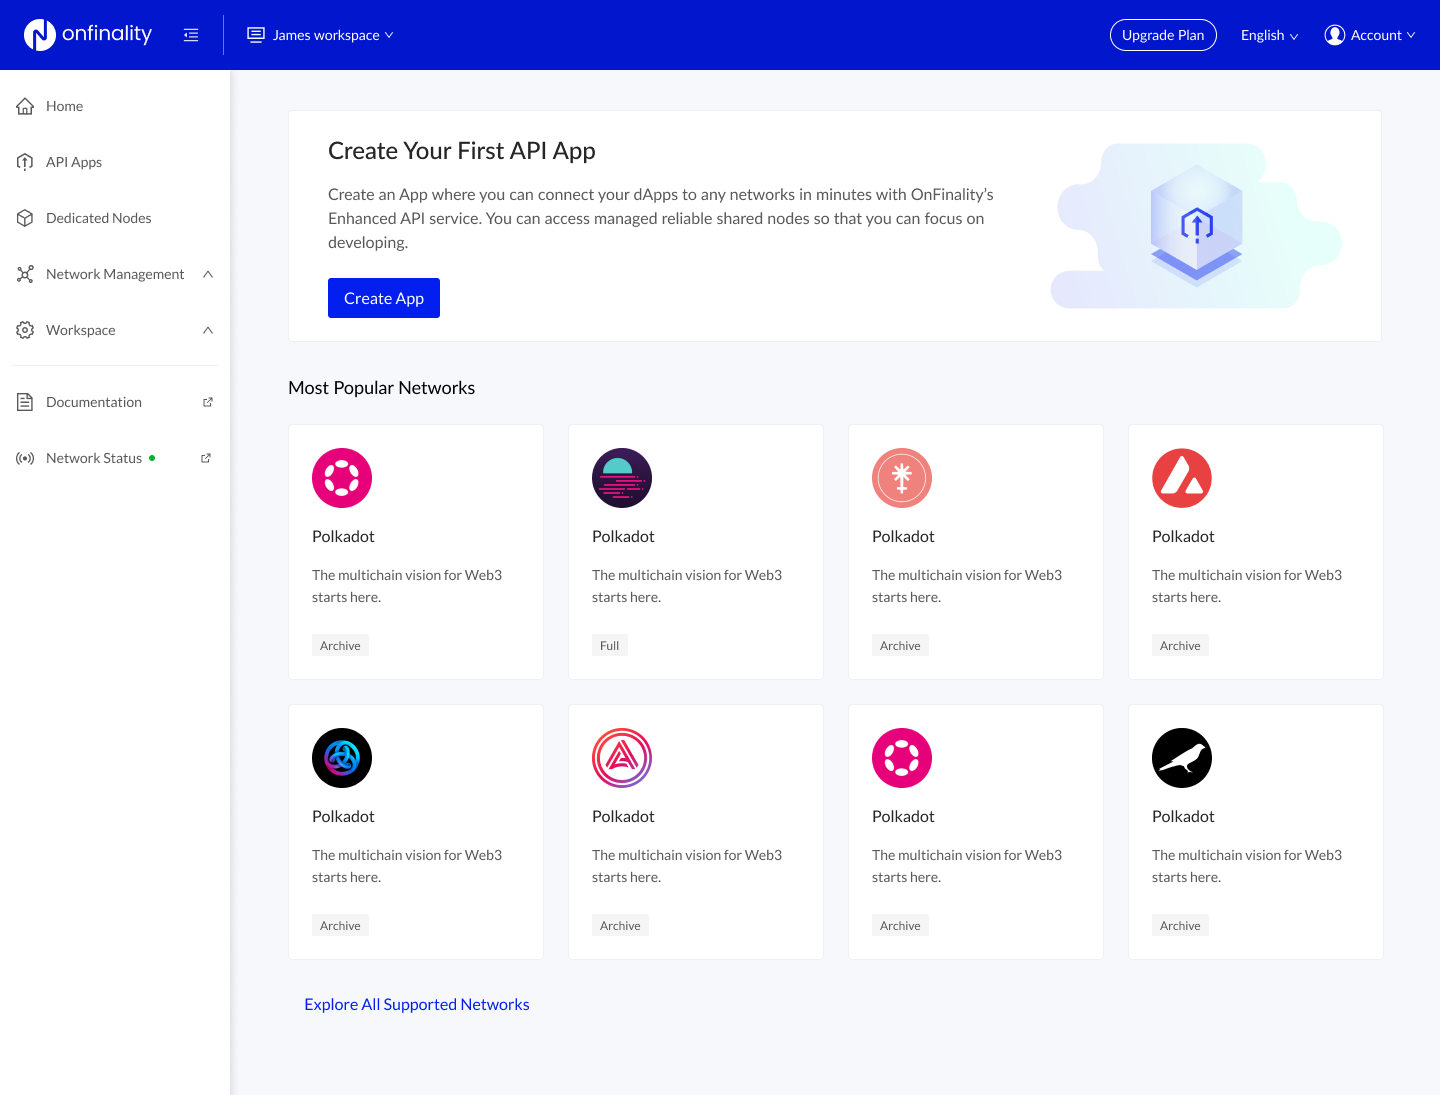
In Web3, contrary to Web2, where all interactions between the user and application are guarded, the blockchain data is public and accessible to anyone. So APIs play a critical role in web3. APIs exist in DeFi for transaction execution, staking, protocol governance, crypto rewards, data analysis, and many other use cases. OnFinality aims to provide a multi-chain API endpoint that developers can interact with various blockchain networks such as Ethereum, Polkadot, and Cosmos. Say goodbye to the hassle of navigating different chains separately.
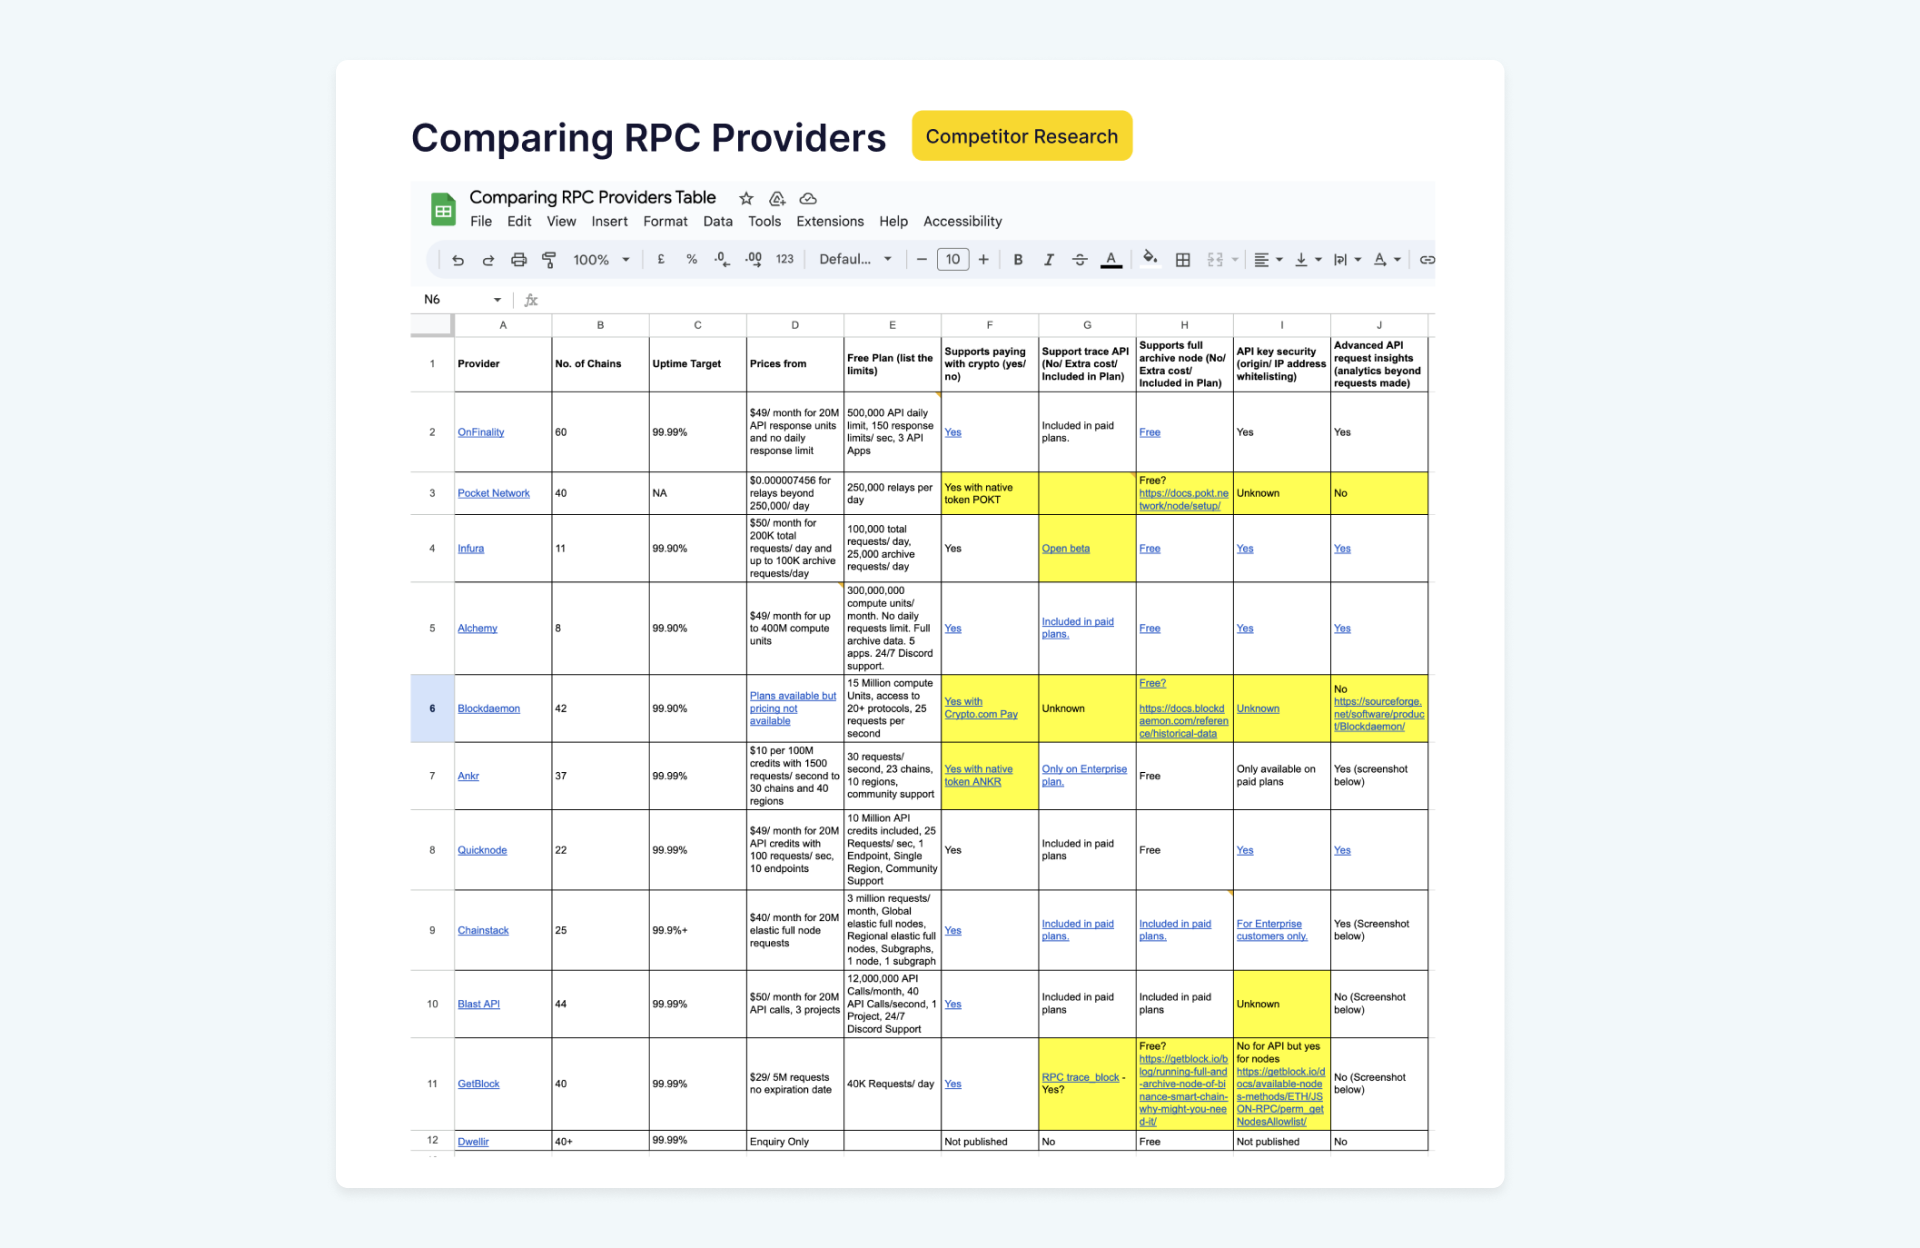
Our main competitor, Alchemy, and Infura, primarily concentrate on the Ethereum ecosystem. However, they limit users to creating a single API endpoint for a single network. This poses a challenge for users who are developing dAPP Wallets as they must handle multiple endpoints for their applications.
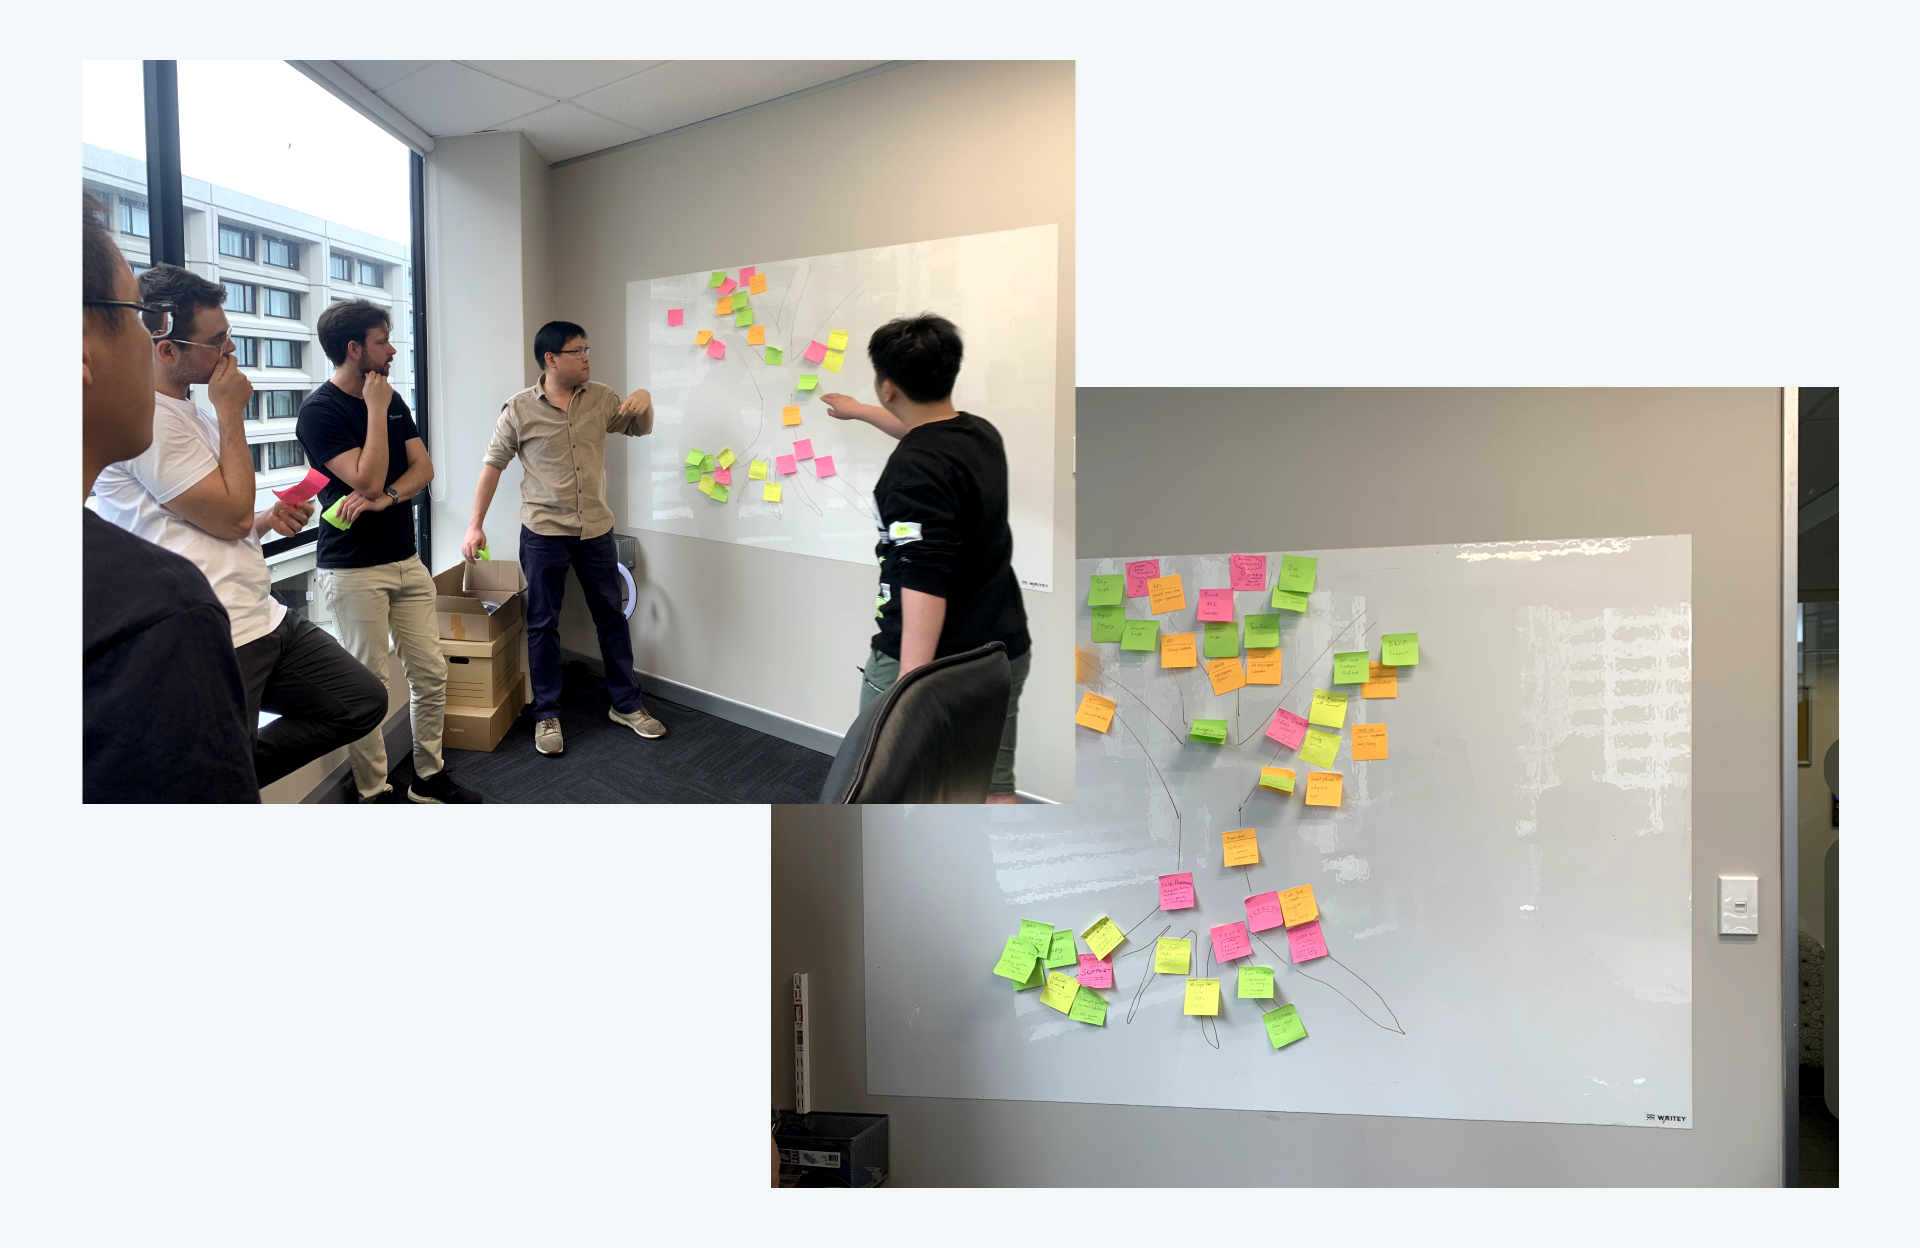
We apply a tree diagram to facilitate idea gathering, continuously focusing on user pain points and aligning them with our business goals throughout the ideation process. This approach has yielded many insights that were previously undiscovered during our discovery phase
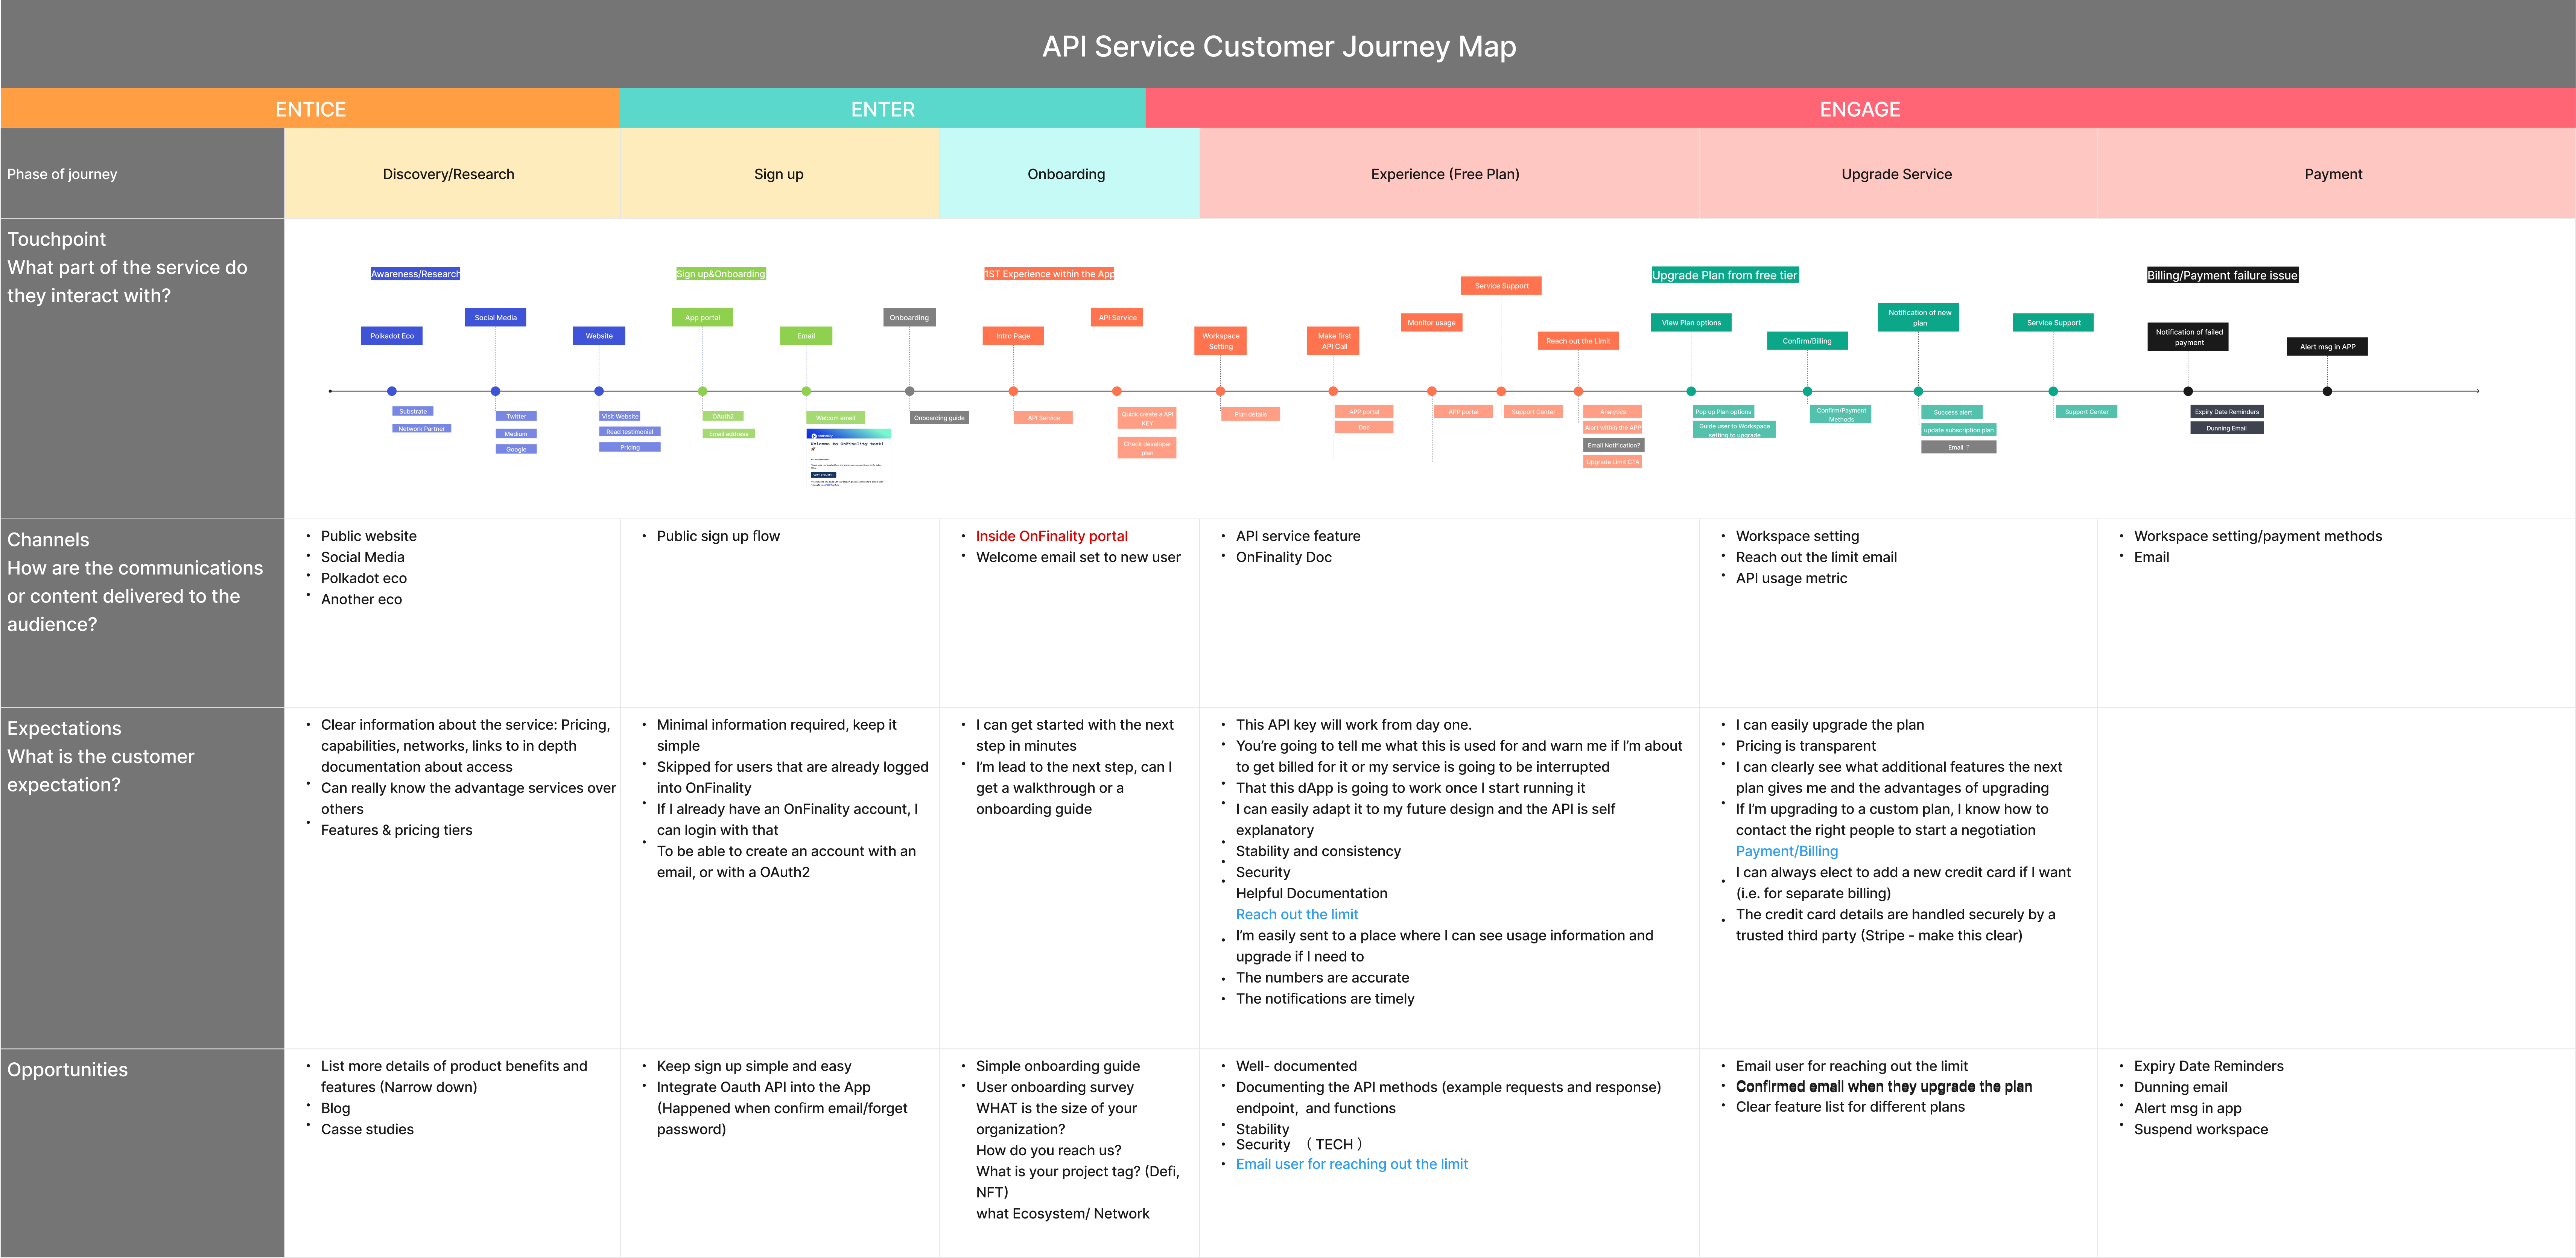
I collaborated closely with the product manager and business development (BD) team to create a comprehensive User Journey Map. This map serves as a visual representation of the process a user experiences as they move through various stages to achieve a specific goal with our product. Our aim was to understand each step of the journey from the user’s perspective, allowing us to better address their needs, motivations, and potential pain points.
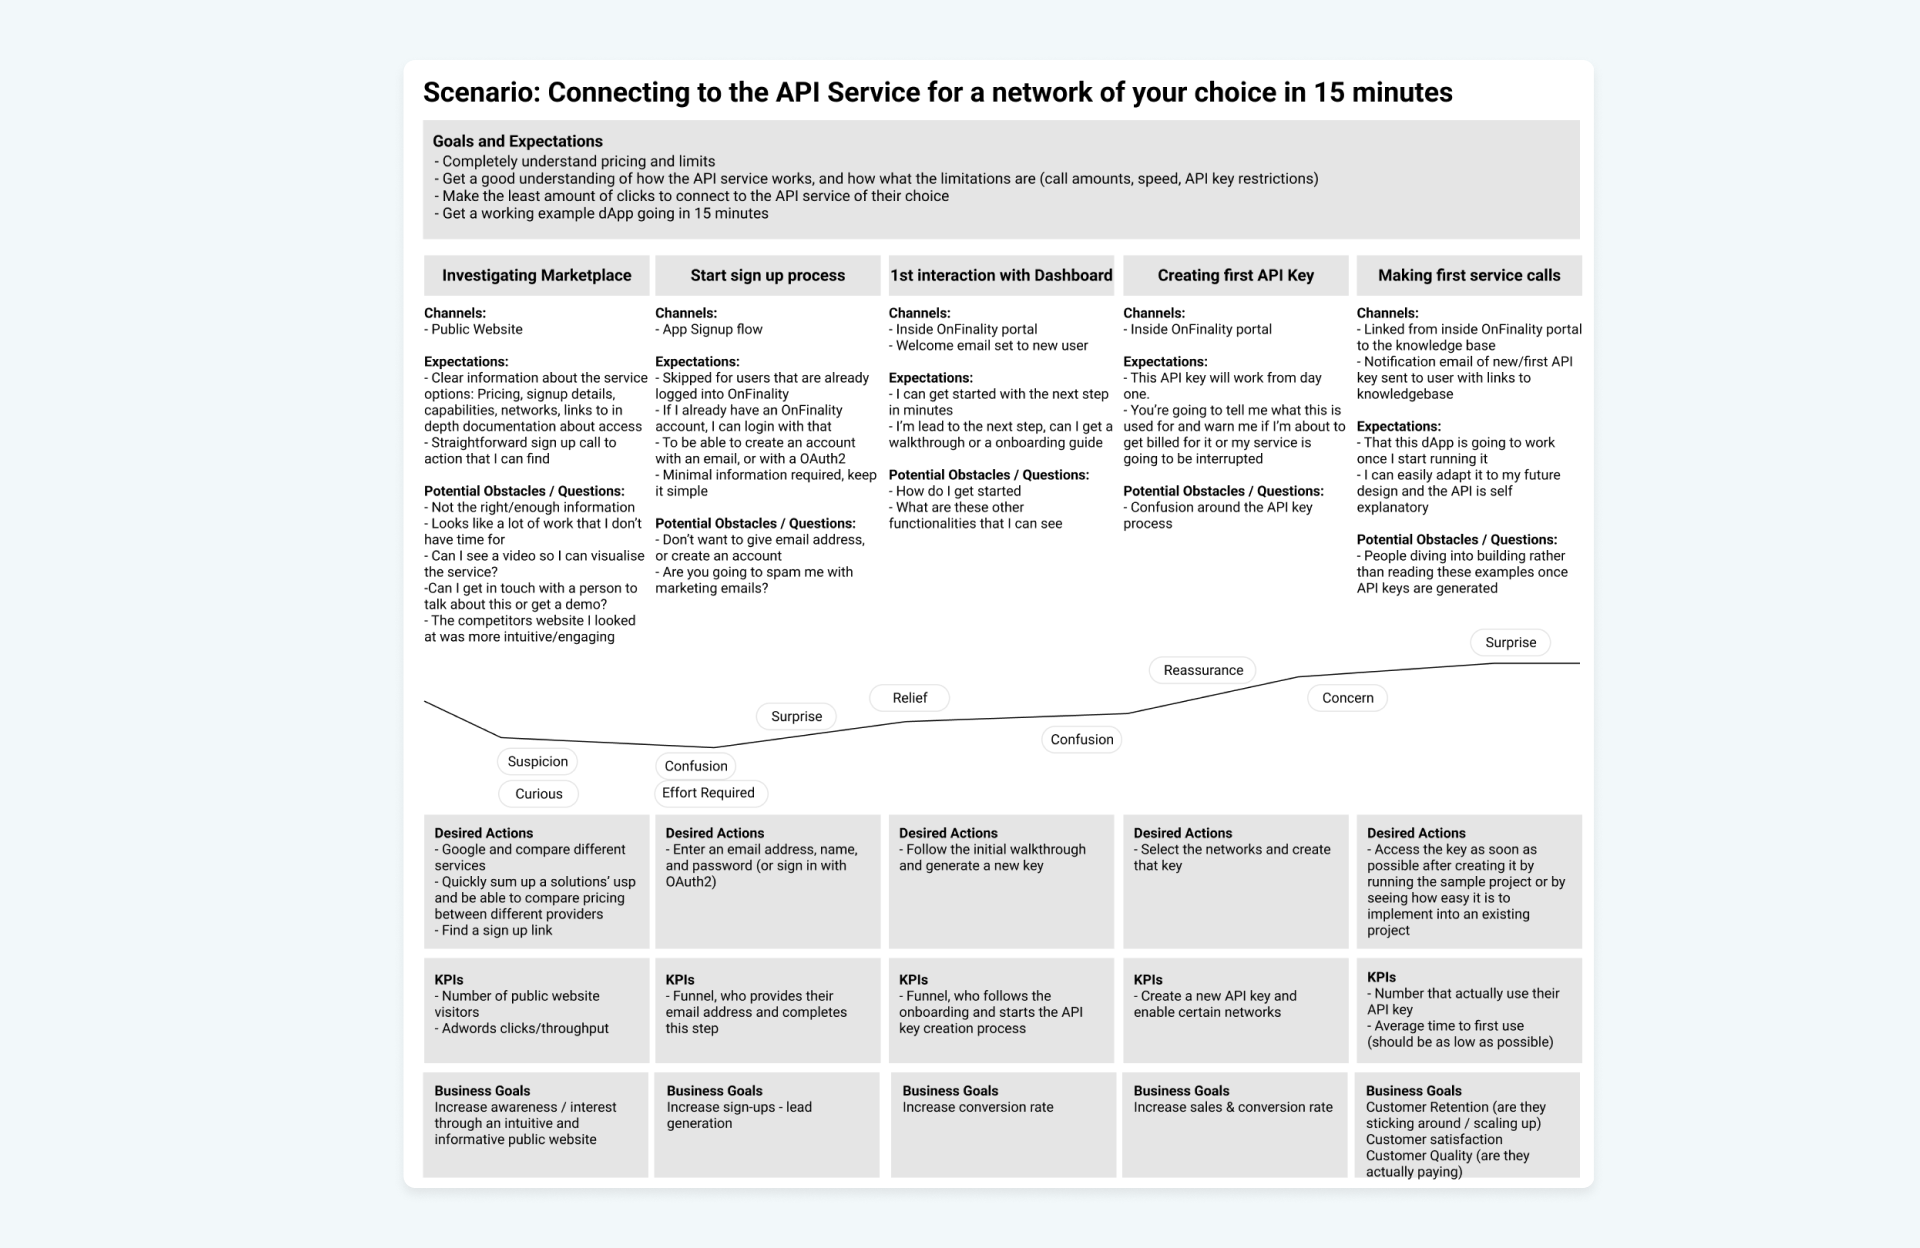
In building this map, we segmented the user journey into distinct stages, such as Awareness, Consideration, Engagement, and Conversion/Retention. For each phase, we pinpointed critical touchpoints where users interact with the product. These touchpoints provided insight into the specific actions users take and highlighted moments that influence their decisions. By examining these interactions, we were able to visualize how users emotionally respond to different steps and where they may encounter friction or obstacles.
Through this collaborative effort, we identified not only where users experience satisfaction and success but also areas with potential for enhancement. This in-depth look at the user journey allowed us to spot opportunities for optimizing the product experience. For example, it led to actionable strategies for reducing user churn, enhancing customer satisfaction, and increasing conversion rates. Additionally, we prioritized improvements that would make the product experience more seamless and enjoyable, reinforcing brand loyalty and fostering long-term user relationships.
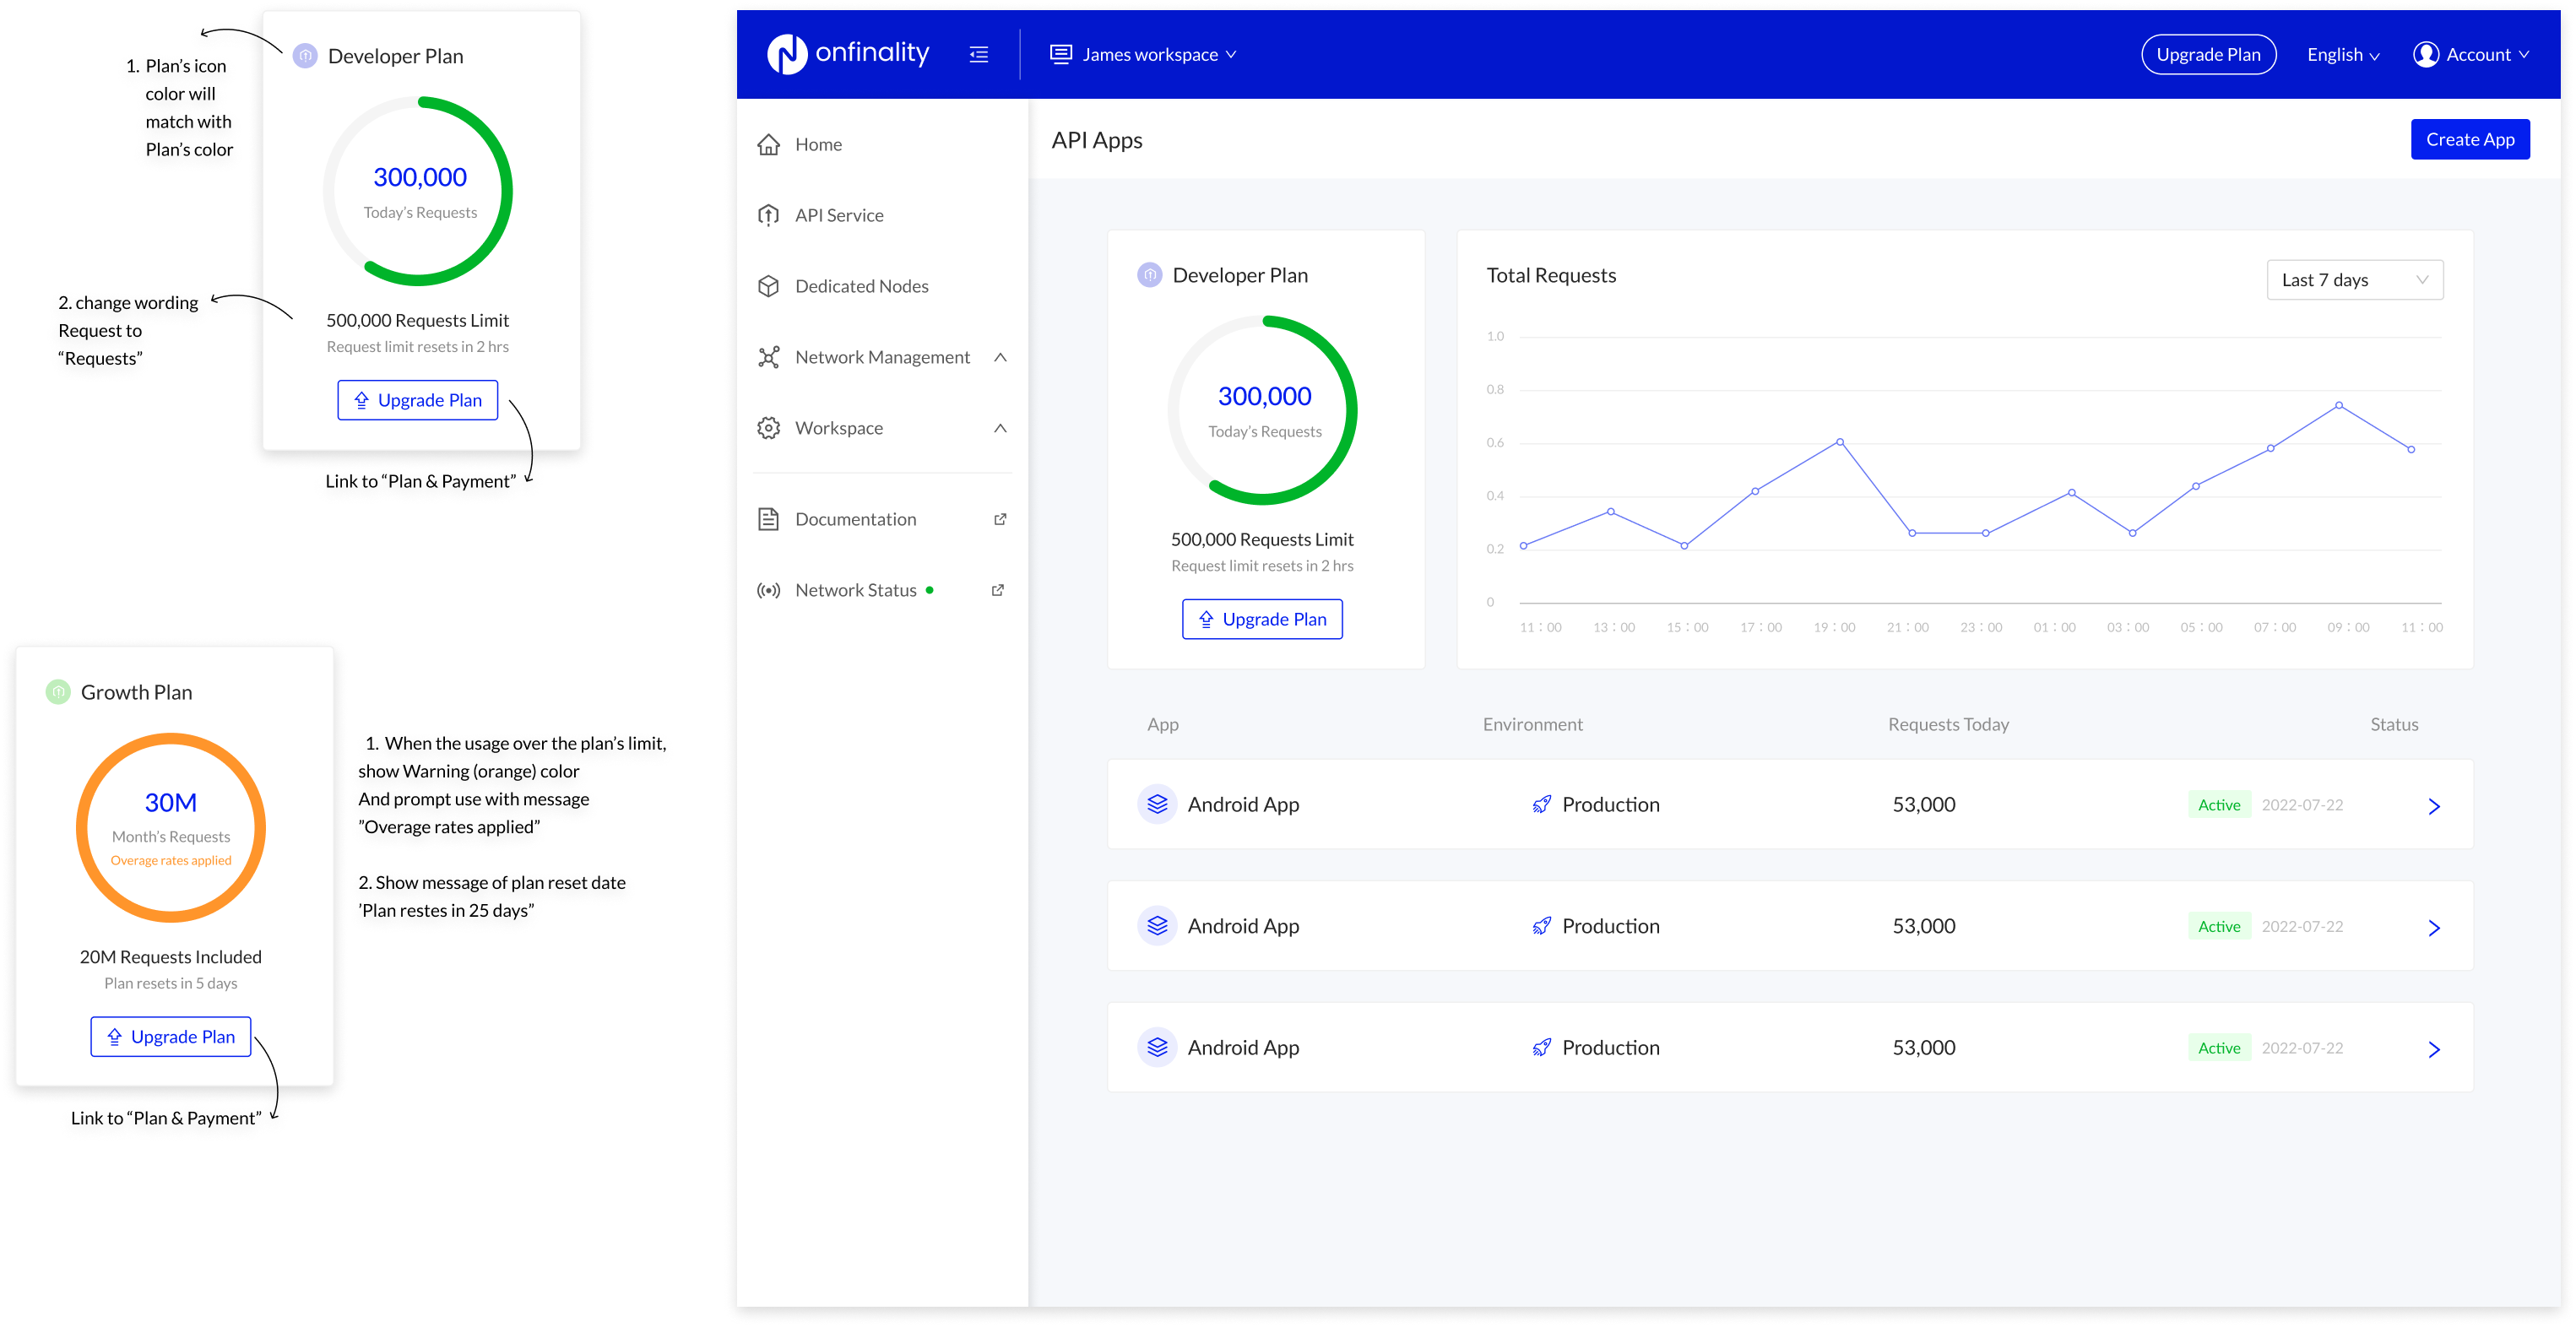
As part of the redesign of the API Service v2, I led an analytics-focused discovery stream to uncover real usage patterns. I collaborated with the engineering team to pull anonymized metrics from internal logs, and cross-referenced it with support tickets and product feedback.
I focused on five key areas:
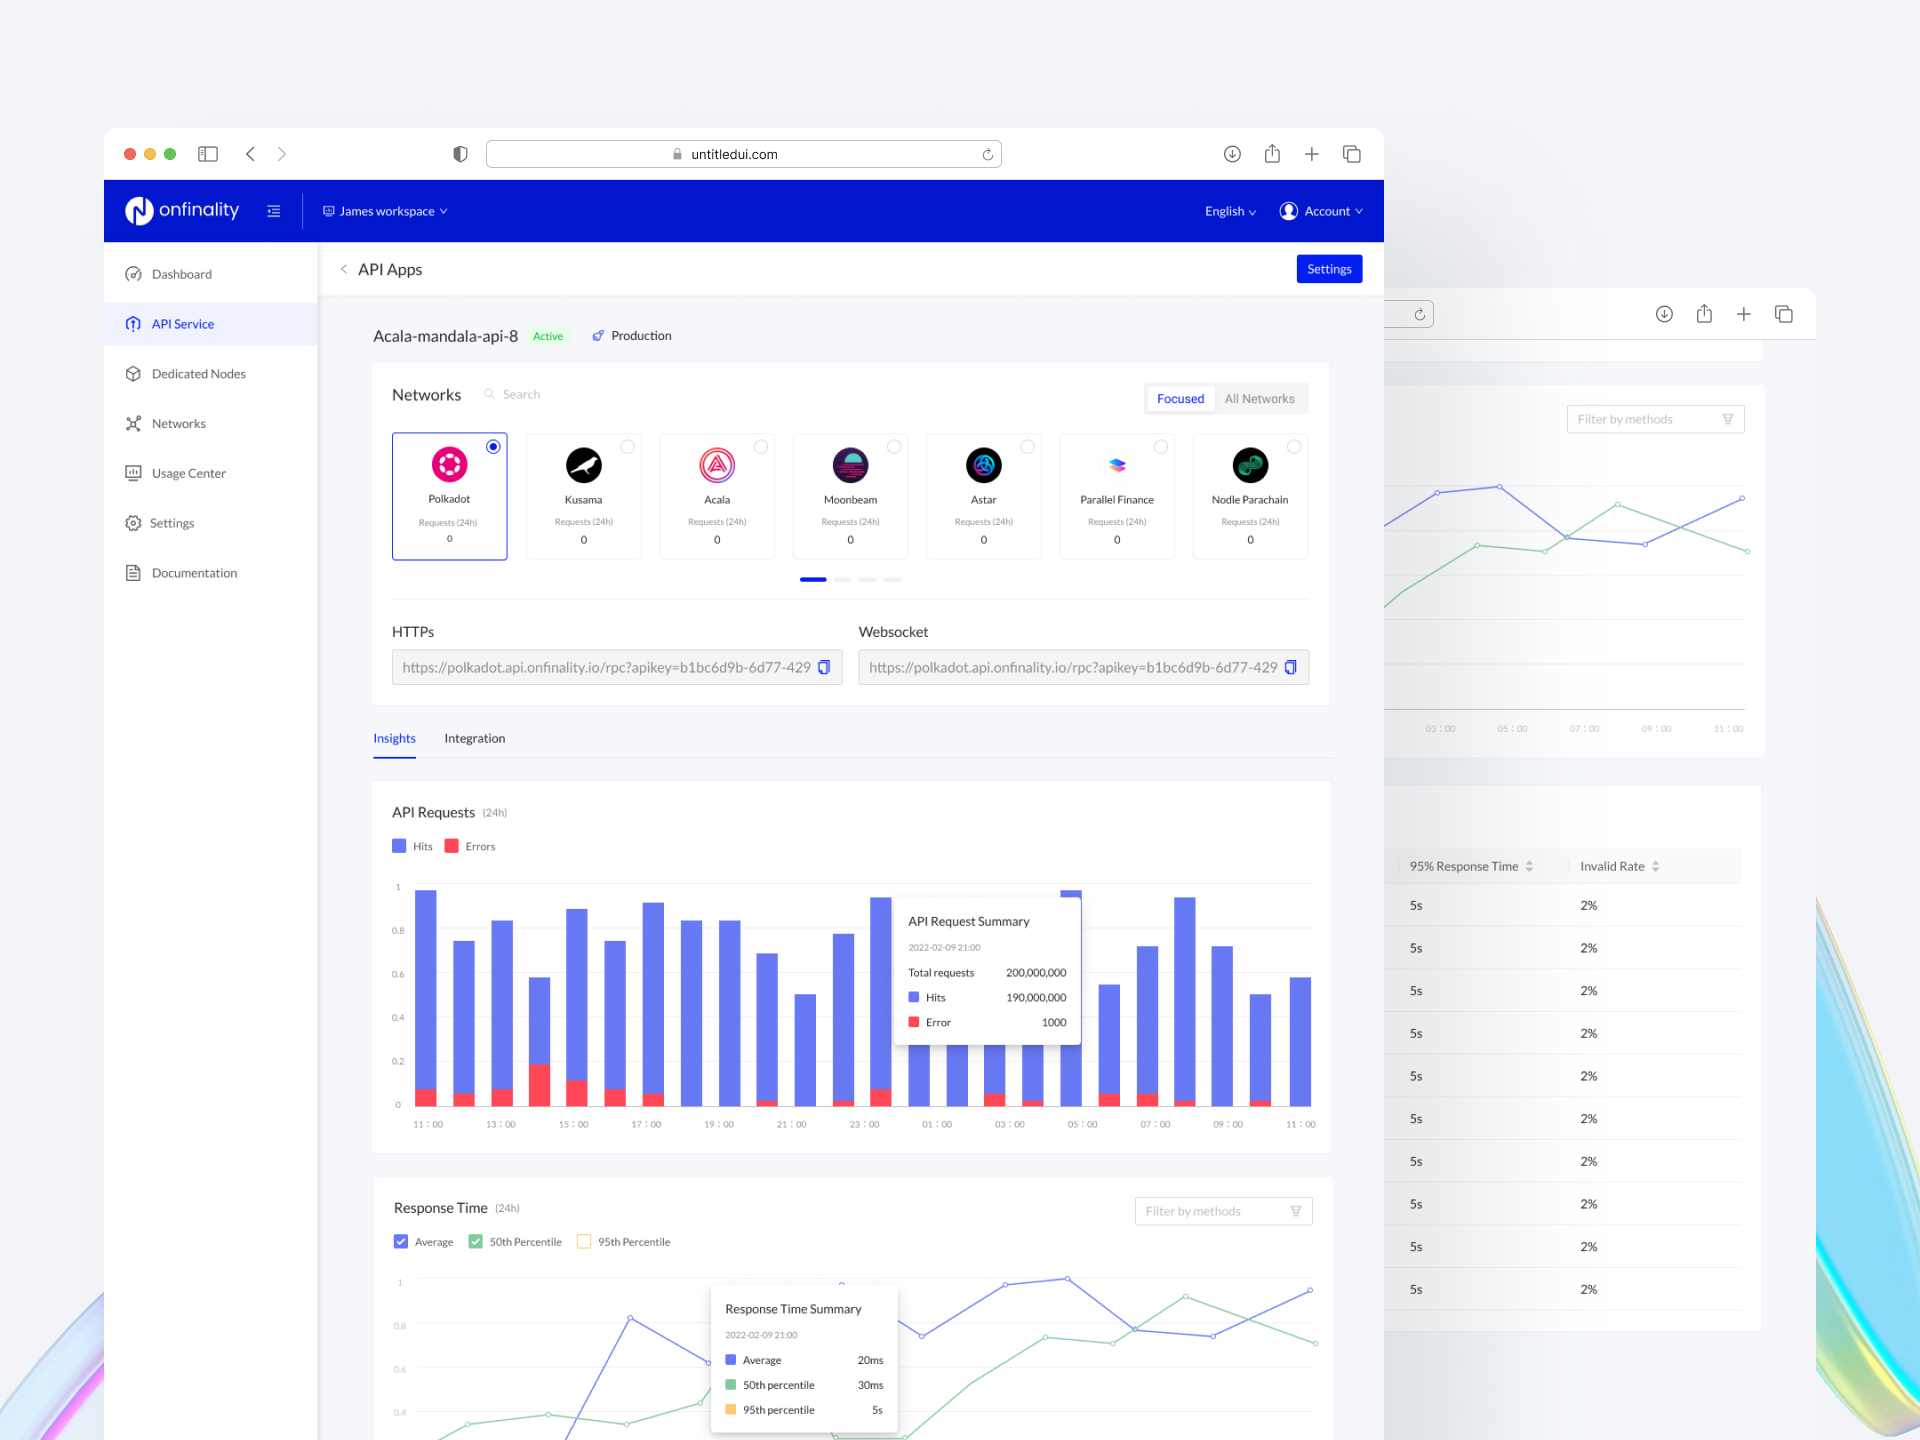
Then, I created a clickable low-fidelity wireframe using Figma, showcasing key features, interactions, and the overall user flow for getting early usability test.
The API data insights analysis feature successfully addressed the challenges associated with analyzing data from diverse API calls. Its user-friendly interface, data integration capabilities, and powerful analysis tools received positive feedback from users. Developers appreciated the ease of connecting and fetching data from various APIs, while data analysts found value in the platform's robust data visualization options and collaboration features. The platform streamlined the process of data insights analysis, enabling users to make data-driven decisions efficiently.